Runtime Monitor
The Game Event Monitor is a powerful real-time debugging and analysis tool that provides comprehensive insights into your event system's behavior during runtime. It helps you identify performance bottlenecks, track event flows, monitor listener relationships, and debug complex event chains.
🎯 Why Use the Runtime Monitor?
Powerful Capabilities
The Runtime Monitor transforms the way you develop and debug event-driven games:
- 🔍 Real-Time Visibility - See exactly when and how events are triggered as they happen
- ⚡ Performance Profiling - Identify slow listeners and optimize execution times
- 📊 Statistical Analysis - Track event frequency, patterns, and usage trends
- 🔗 Flow Visualization - Understand complex trigger and chain relationships at a glance
- ⚠️ Automatic Warnings - Catch performance issues and potential problems early
- 👂 Listener Inspector - Monitor all active subscriptions and their sources
- 📝 Event Logs - Complete execution history with stack traces for debugging
What This Means for Your Development
- Faster Debugging: Instantly see which events fired and in what order
- Performance Optimization: Identify and fix slow listeners before they impact gameplay
- Architecture Understanding: Visualize event flows to maintain clean system design
- Proactive Problem Detection: Catch issues like memory leaks and recursive calls automatically
- Team Collaboration: Share visual representations of event flows with team members
🚀 Opening the Monitor
Access from Game Event System Window
The Runtime Monitor is accessed through the main Game Event System window:
- Open the Game Event System window:
Tools > TinyGiants > Game Event System - Click the "Game Event Monitor" button in the Editor & Monitor toolbar
- The Game Event Monitor window will open
The monitor window can be docked alongside your other Unity editor windows for convenient access during play mode. We recommend docking it near your Console or Inspector windows.
📱 Interface Overview
Initial Window State
When you first open the Game Event Monitor, you'll see the window in its stopped state (not in Play Mode):
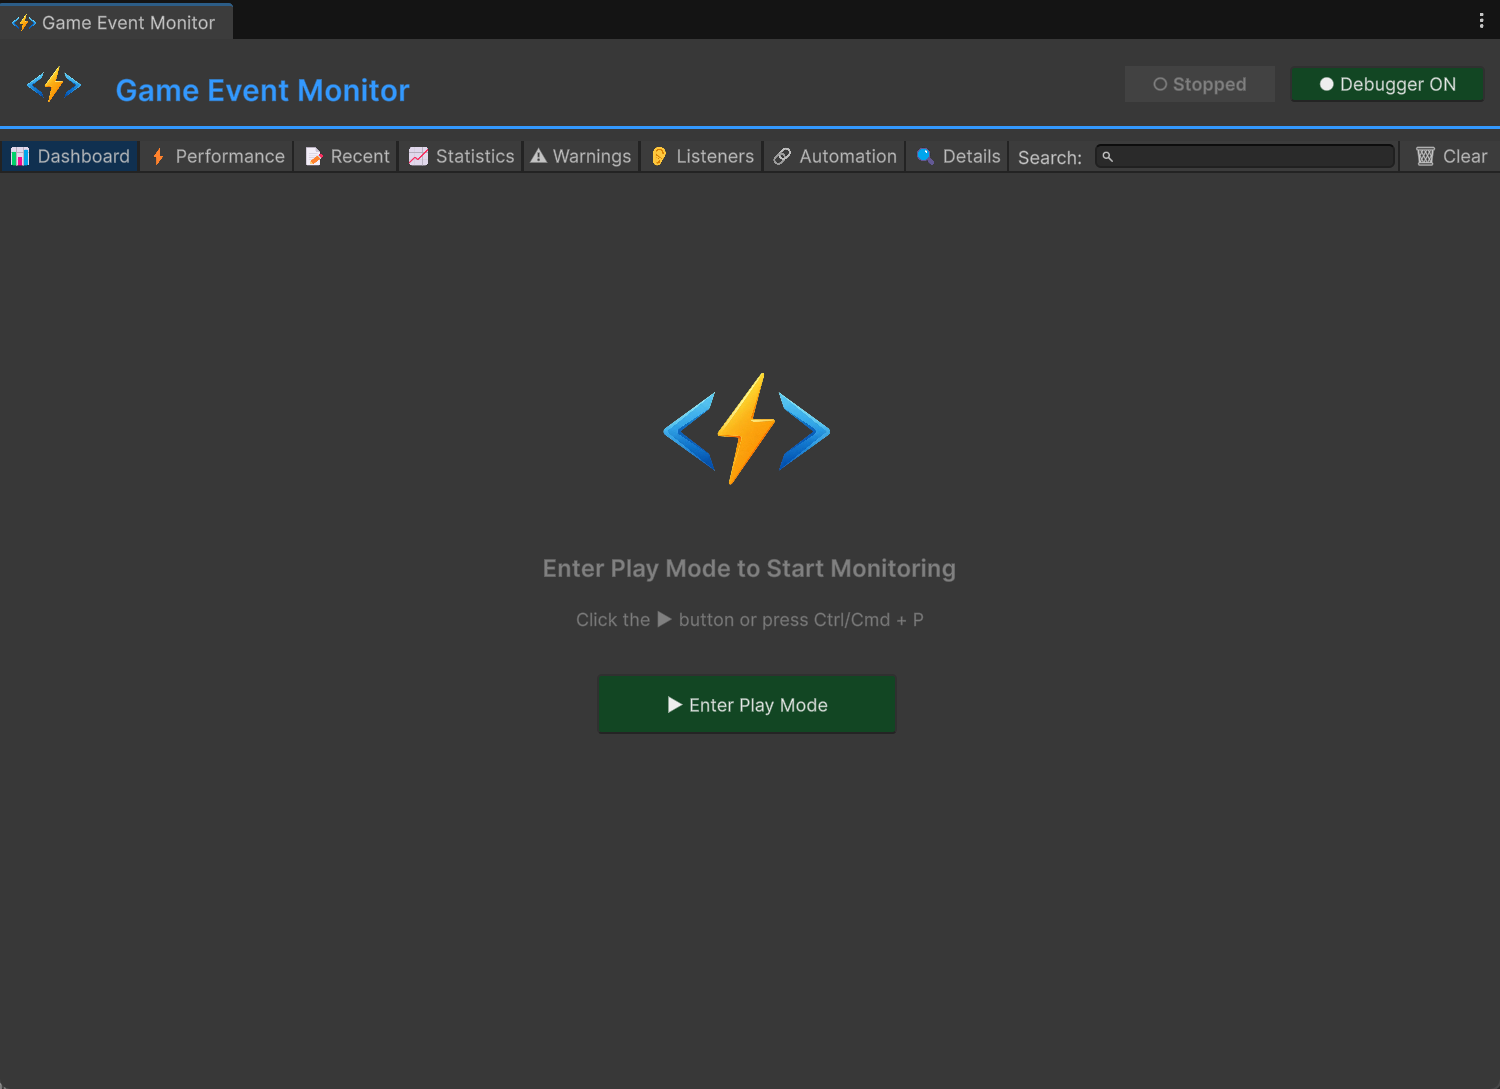
Key Elements in Stopped State:
- Header Bar - Displays the Game Event System logo and window title
- Status Indicator - Shows "○ Stopped" in gray (not in Play Mode)
- Debugger Toggle - Button to enable/disable event tracking
- Tab Navigation - 8 main tabs (grayed out until Play Mode)
- Play Mode Prompt - Central message guiding you to enter Play Mode
The Runtime Monitor only collects and displays data during Play Mode. All monitoring features are disabled in Edit Mode to avoid performance overhead.
Window Components
The monitor interface consists of several key areas:
1. Header Bar
Located at the top of the window, the header contains:
-
🎮 Logo & Title - Visual branding and window identification
-
Status Badge
- Shows current state:
- Running (green) - Play Mode is active, monitoring events
- Stopped (gray) - Edit Mode, no monitoring
-
Debugger Toggle
- Controls whether events are being tracked:
- Debugger ON (green) - Actively recording events
- Debugger OFF (red) - Not recording (saves performance)
2. Navigation Toolbar
Below the header, you'll find the main navigation tabs:
| Tab | Icon | Purpose |
|---|---|---|
| Dashboard | 📊 | Overview of all monitoring data |
| Performance | ⚡ | Execution time analysis and profiling |
| Recent | 📝 | Chronological event log |
| Statistics | 📈 | Event frequency and usage patterns |
| Warnings | ⚠ | Performance issues and problems |
| Listeners | 👂 | Active subscriptions overview |
| Automation | 🔗 | Trigger and chain flow visualization |
| Details | 🔍 | Deep dive into selected events |
3. Search & Controls
On the right side of the toolbar:
- Search Field - Filter events across all tabs
- Clear Menu - Options to clear different data types
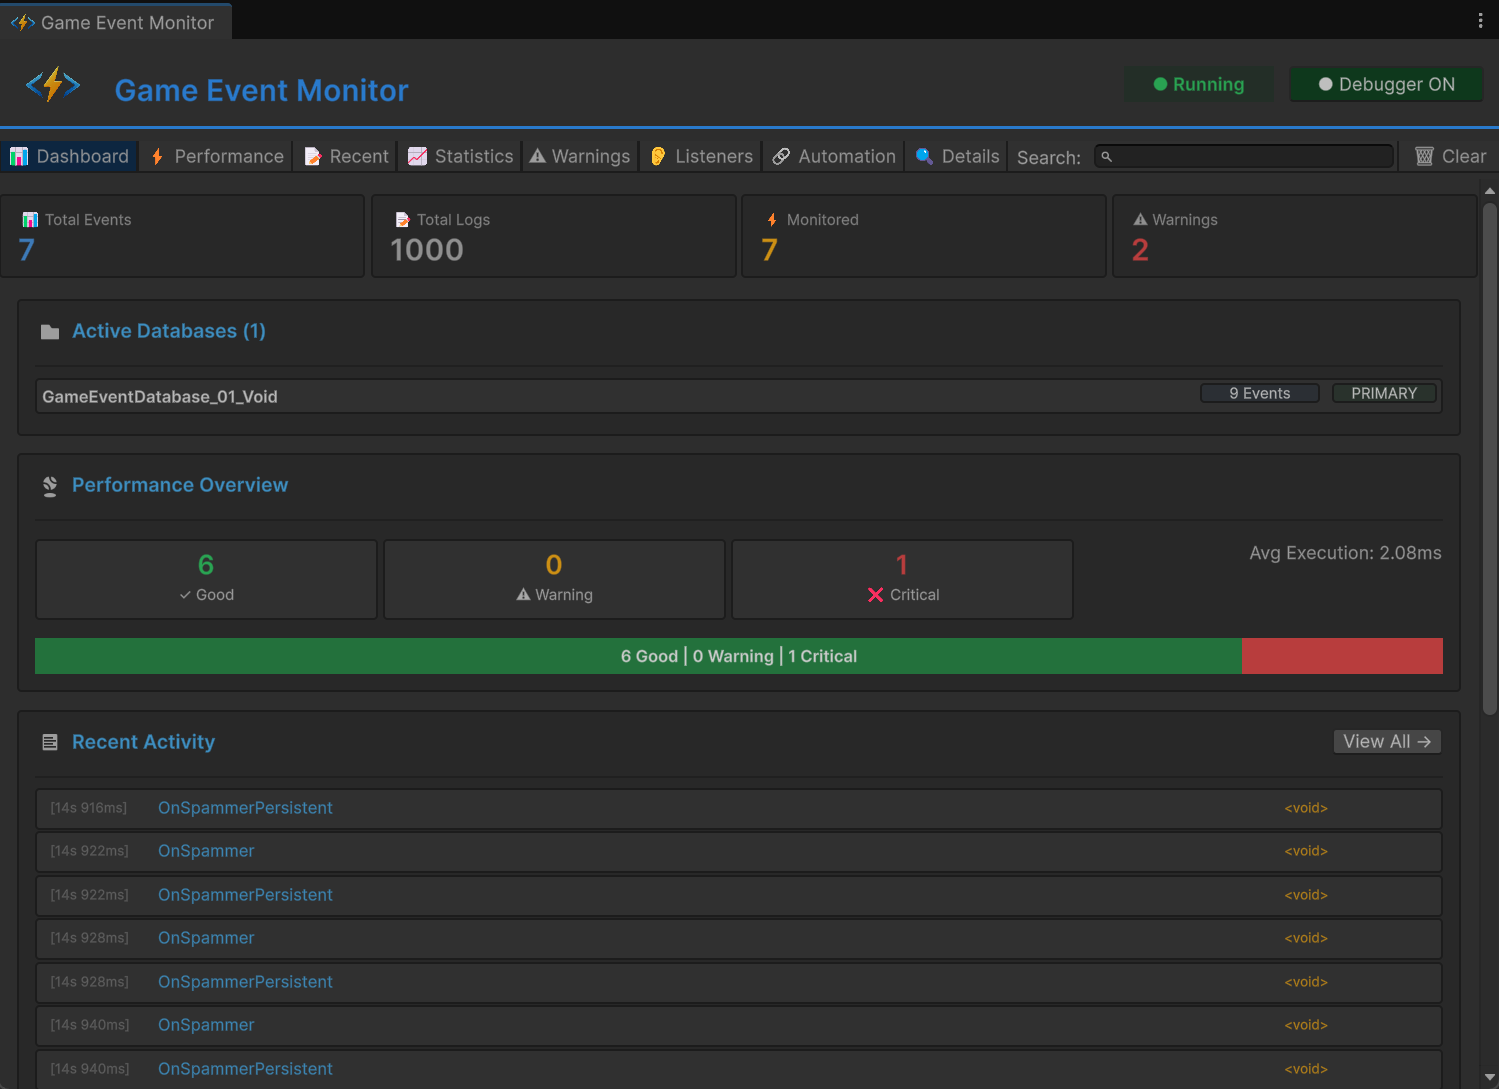
📊 Dashboard Tab
The Dashboard provides a high-level overview of your entire event system's health and activity.
Metric Cards
At the top, four metric cards display key statistics:
📊 Total Events
- What it shows: Number of unique events in your game
- Includes: All events across all active databases
- Use case: Understand the scale of your event system
📝 Total Logs
- What it shows: Number of event executions recorded
- Updates: In real-time as events fire
- Use case: Track overall system activity
⚡ Monitored
- What it shows: Number of events with performance data
- Criteria: Only events that have been triggered
- Use case: See which events have profiling info
⚠ Warnings
- What it shows: Count of active performance warnings
- Color: Red if any warnings exist
- Use case: Quick problem detection
Active Databases Section
Displays all currently loaded Game Event Databases:
📁 Active Databases (2)
├─ CoreEvents          [42 Events]  [PRIMARY]
└─ UIEvents            [18 Events]
Information Displayed:
- Database name and asset reference
- Total event count per database
- PRIMARY badge for the main database
- Click database name to select it in Project window
Performance Overview
Visual representation of event execution health:
Performance Levels:
- ✓ Good (Green) - Execution time < 1ms
- ⚠ Warning (Yellow) - Execution time 1-10ms
- ❌ Critical (Red) - Execution time > 10ms
Visual Breakdown:
- Color-coded bar showing distribution
- Percentage of events in each category
- Average execution time across all events
- Click "View All →" to jump to Performance tab
Aim for keeping 90%+ of your events in the "Good" category for smooth gameplay. Events in "Critical" should be optimized immediately.
Recent Activity
Shows the last 15 events that fired:
Each Entry Displays:
- [Timestamp] - When the event was raised (HH:MM:SS.mmm)
- Event Name - The event that was triggered
- Event Type - Generic type (e.g.,
GameEvent<int>)
Quick Actions:
- Click any entry to view full details
- Entries update in real-time during Play Mode
- Click "View All →" to see complete history
Quick Warnings
If any warnings are active, they appear at the bottom:
Warning Types:
- 🔥 Performance - Events executing too slowly
- ⚠️ High Frequency - Events firing too often
- 💾 Memory - Potential memory issues
- 🔄 Recursive - Possible infinite loops
For Each Warning:
- Severity indicator (color-coded)
- Clear description of the issue
- Number of affected events
- Click "View All →" to see full list
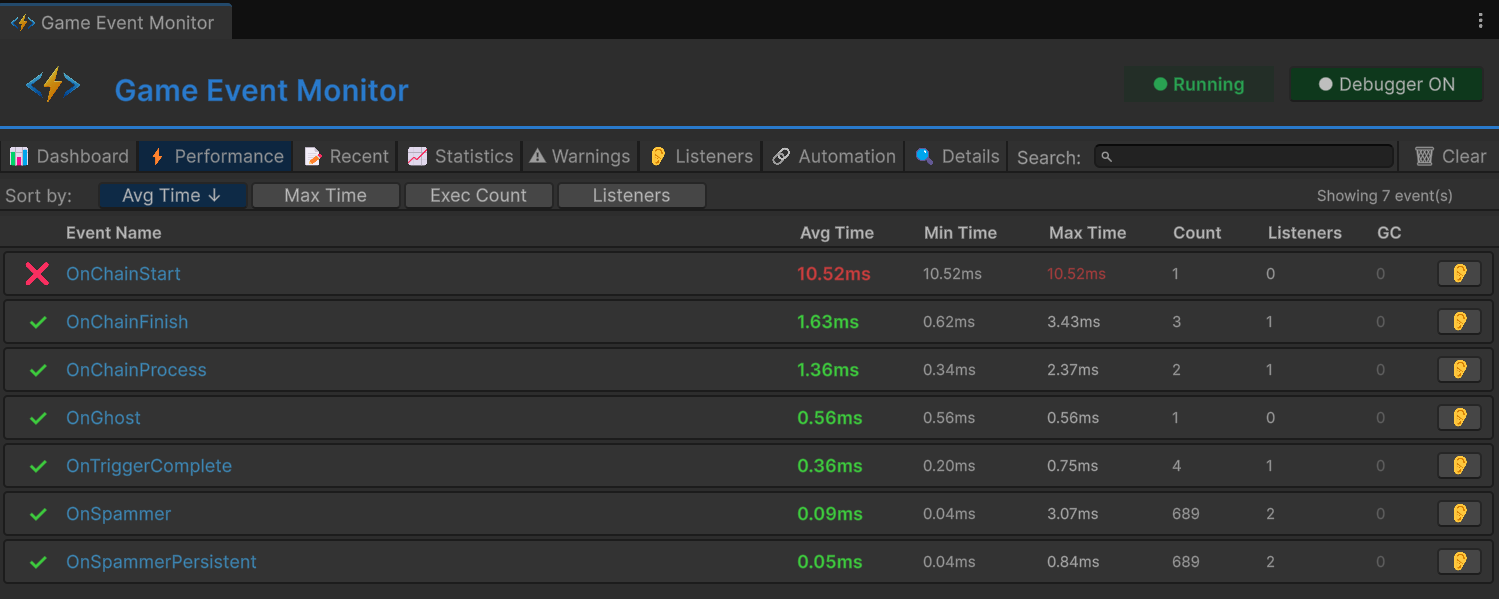
⚡ Performance Tab
Detailed performance profiling for every event that has been triggered.
Sorting Controls
At the top of the tab, you can sort the performance data:
Sort Options:
- Avg Time ⬇️ - Average execution time (default, descending)
- Max Time - Maximum recorded execution time
- Exec Count - Number of times executed
- Listeners - Average number of listeners
Sort Direction:
- ⬇️ Descending (high to low)
- ⬆️ Ascending (low to high)
- Click the same button again to toggle direction
Performance Table
Each row displays comprehensive metrics for a single event:
| Column | Description | Color Coding |
|---|---|---|
| Icon | Performance level indicator | 🟢 Good / 🟡 Warning / 🔴 Critical |
| Event Name | Full name of the event | Blue (clickable) |
| Avg Time | Average execution duration | Green < 1ms, Yellow 1-10ms, Red > 10ms |
| Min Time | Fastest execution recorded | Gray |
| Max Time | Slowest execution recorded | Red if > 10ms |
| Count | Total number of executions | White |
| Listeners | Average number of listeners | White |
| GC | Garbage collection allocations | Red if > 0, Gray if 0 |
| 👂 | View listeners button | Opens Listeners tab |
Reading Performance Data
Example Row:
🟢 PlayerHealthChanged 1.2ms 0.8ms 3.5ms Count: 156 Listeners: 4 GC: 0 [👂]
Interpretation:
- ✅ Event is performing well (green icon)
- Executes in 1.2ms on average (acceptable)
- Fastest execution was 0.8ms
- Slowest execution was 3.5ms
- Has been triggered 156 times
- Has 4 active listeners
- No GC allocations (excellent!)
- Avg Time > 5ms: Should be optimized
- Max Time > 16ms: Will cause frame drops
- GC > 0: Creating garbage, refactor to avoid allocations
- High Listener Count: Consider consolidating listeners
Quick Actions
- 👂 Button: Jump to Listeners tab for this specific event
- Click Row: Select event to view in Details tab
- Search: Filter events by name in real-time
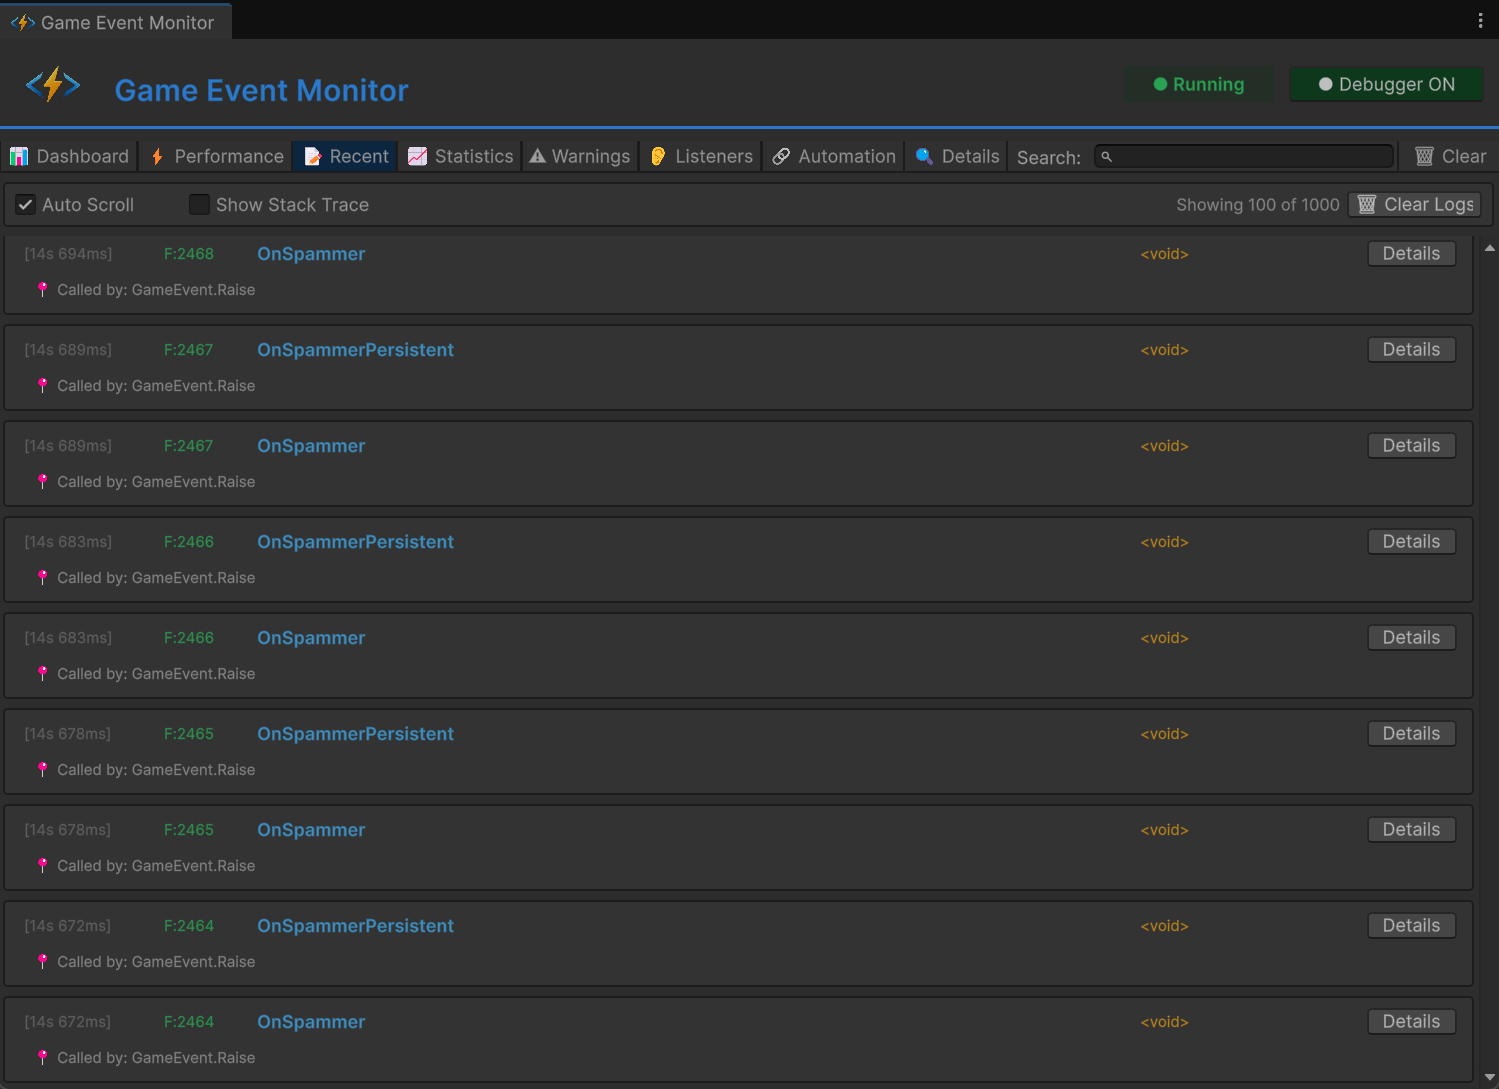
📝 Recent Events Tab
Complete chronological log of all event executions.
Control Options
At the top of the tab:
Toggle Options:
- ☑️ Auto Scroll - Automatically scrolls to newest events
- ☐ Show Stack Trace - Displays call stack for each event
Status Indicator:
- "Showing X of Y" - Displays how many events are visible
Actions:
- 🗑 Clear Logs - Removes all logged events
Log Entry Format
Each log entry shows:
[14:23:45.123]  F:1250  PlayerTakeDamage  <GameEvent<GameObject, DamageInfo>>  [Details]
  📍 Called by: EnemyController.Attack()
Entry Components:
- [Timestamp] - Precise time of execution (HH:MM:SS.mmm)
- F:#### - Frame number when event fired
- Event Name - Name of the triggered event
- [Type] - Generic type signature
- [Details] - Button to view full information
- 📍 Caller Info - Method that raised the event
Stack Trace View
When Show Stack Trace is enabled, each entry expands to show:
at GameEventSystem.GameEvent.Raise()
at PlayerController.TakeDamage(float amount) in Assets/Scripts/Player.cs:line 45
at EnemyController.Attack() in Assets/Scripts/Enemy.cs:line 89
...
Use Cases:
- Track down where events are being triggered
- Debug unexpected event calls
- Understand execution flow
- Identify performance bottlenecks in calling code
Search & Filter
Use the search box to filter logs by:
- Event name (e.g., "Player")
- Event type (e.g., "GameObject")
- Partial matches work
- Enable Auto Scroll to see events as they happen
- When you spot an issue, disable auto scroll
- Enable Show Stack Trace to see call hierarchy
- Click Details to view full event information
- Use this data to track down and fix the problem
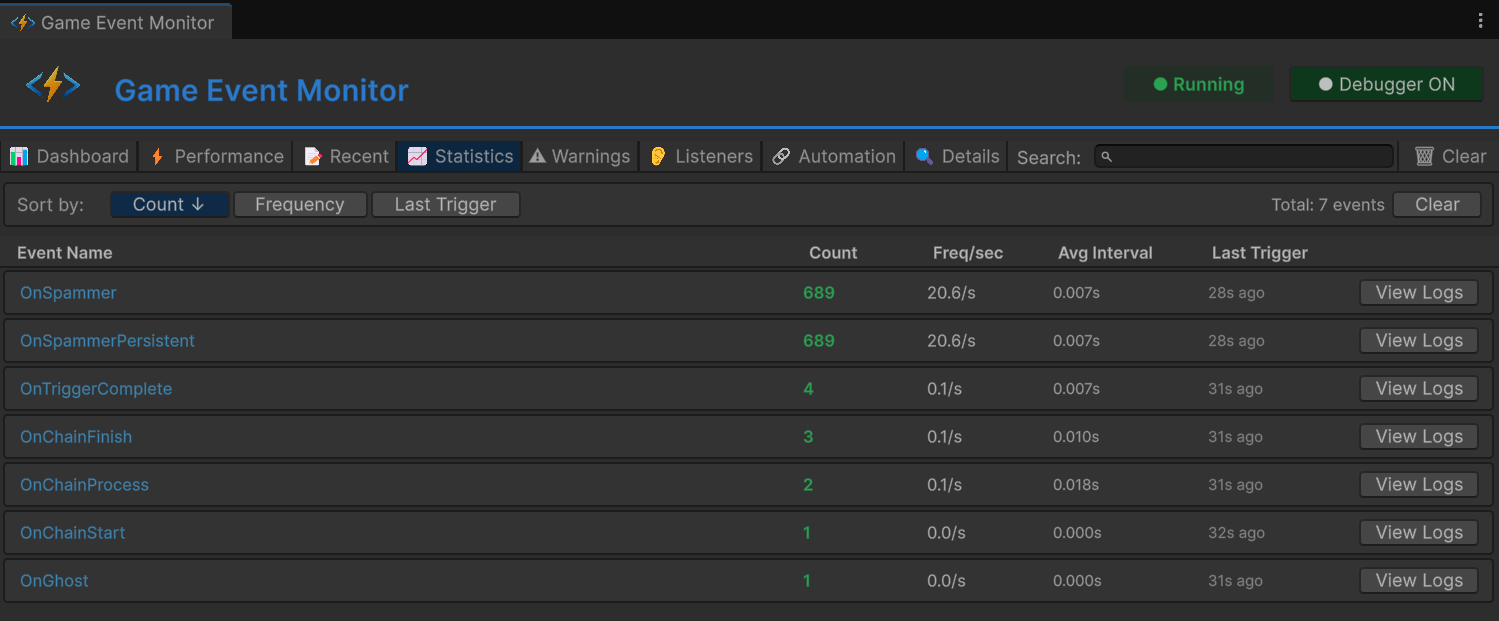
📈 Statistics Tab
Analyze event usage patterns and frequency over time.
Sorting Controls
Sort statistics by different metrics:
Sort Options:
- Count ⬇️ - Total number of triggers (default)
- Frequency - Triggers per second
- Last Trigger - Most recently fired events
Statistics Table
Each row displays usage metrics:
| Column | Description | Interpretation |
|---|---|---|
| Event Name | Name of the event | Blue, clickable |
| Count | Total executions | Green, higher = more used |
| Freq/sec | Triggers per second | Red if > 60/sec |
| Avg Interval | Average time between triggers | In seconds |
| Last Trigger | Time since last execution | Relative time |
| View Logs | See all logs for this event | Opens Details tab |
Understanding Frequency Data
Example Row:
PlayerMoved Count: 2,450 Freq/sec: 30.2/s Avg Interval: 0.033s Last Trigger: 2s ago [View Logs]
Analysis:
- Event has fired 2,450 times total
- Triggering ~30 times per second (every frame at 30 FPS)
- Average of 0.033 seconds between triggers
- Last fired 2 seconds ago
Frequency Interpretation:
- < 1/sec: Rare events (boss spawns, level transitions)
- 1-10/sec: Regular events (ability cooldowns, pickups)
- 10-60/sec: High frequency (movement, input polling)
- > 60/sec: ⚠️ Very high, may need optimization
Warning Events firing at > 60/sec appear in red. While this isn't always a problem, it may indicate:
- Redundant event raises
- Events in Update() that should be in FixedUpdate()
- Unnecessary event traffic that could be batched
Use Cases
Identify Unused Events:
- Sort by Count ascending
- Events with low counts may be dead code
Find Performance Hotspots:
- Sort by Frequency descending
- High-frequency events should be highly optimized
Debug Event Timing:
- Check Avg Interval to understand event patterns
- Irregular intervals may indicate bugs
Track Recent Activity:
- Sort by Last Trigger descending
- See which events are currently active
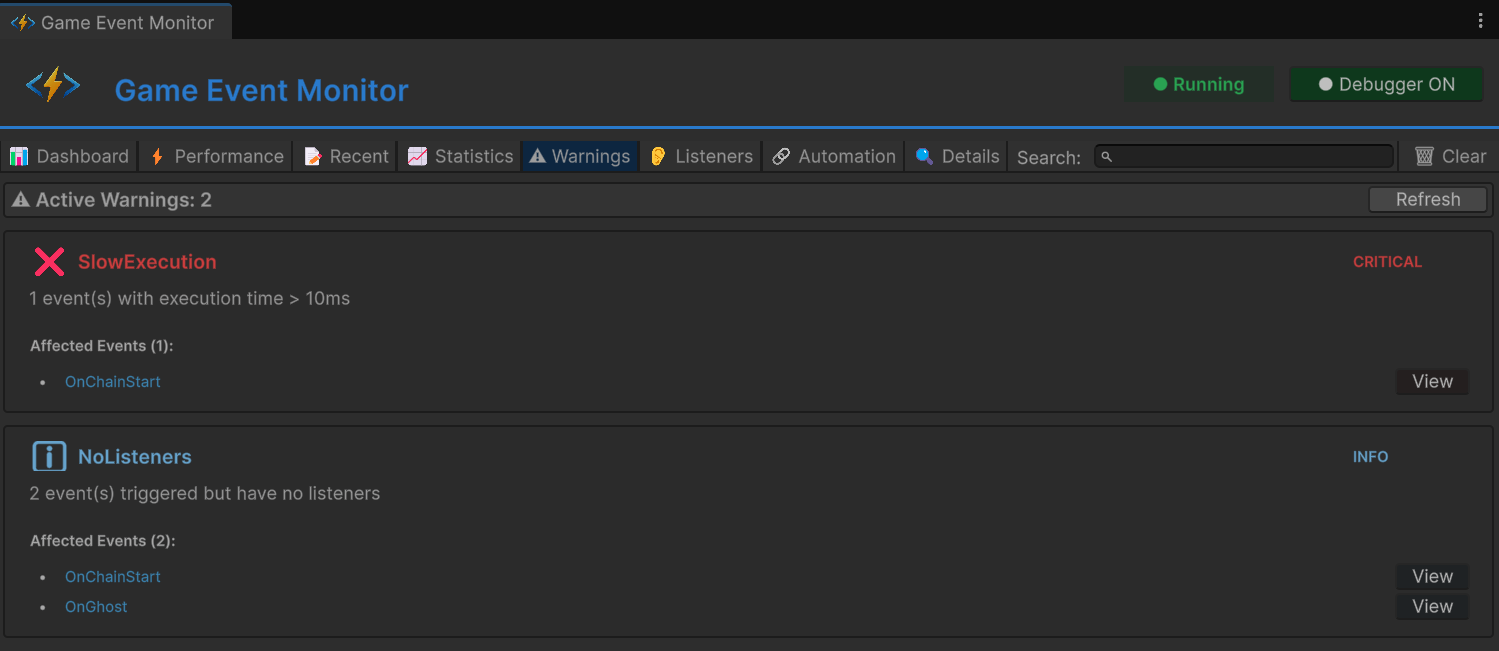
⚠️ Warnings Tab
Automatic detection of performance issues and potential problems.
Warning Categories
The system automatically detects several types of issues:
🔥 Performance Issues
Slow Execution:
❌ CRITICAL
Slow Event Execution
Events are taking too long to execute (> 10ms average)
Affected Events (3): PlayerUpdate, EnemyAI, PhysicsSync
Detection Criteria:
- Average execution time > 10ms
- Maximum execution time > 16ms (one frame at 60 FPS)
Impact: Can cause frame drops and stuttering
Solution: Optimize listener code, move heavy work to coroutines
⚡ High Frequency Warnings
Excessive Triggering:
⚠️ WARNING
High Frequency Events
Events are firing more than 60 times per second
Affected Events (2): OnMouseMove, OnColliderCheck
Detection Criteria:
- Triggers per second > 60
Impact: CPU overhead, potential unnecessary work
Solution: Batch updates, use throttling, consider alternative patterns
💾 Memory Warnings
GC Allocations:
⚠️ WARNING
Garbage Collection Detected
Events are causing GC allocations during execution
Affected Events (5): SpawnParticle, CreateUI, LoadAsset
Detection Criteria:
- GC allocations > 0 per execution
Impact: Garbage collection pauses, frame drops
Solution: Use object pooling, avoid creating new objects in hot paths
🔄 Recursive Call Detection
Potential Infinite Loops:
❌ CRITICAL
Possible Recursive Event
Event may be triggering itself, creating a loop
Affected Events (1): OnValueChanged
Detection Criteria:
- Event raised from within its own listener
- Stack trace shows recursion
Impact: Stack overflow, Unity freeze
Solution: Add recursion guards, redesign event flow
Warning Card Layout
Each warning displays:
Header:
- Icon (🔥/⚠️/ℹ️) indicating severity
- Warning type (e.g., "Slow Execution")
- Severity badge (CRITICAL / WARNING / INFO)
Body:
- Clear description of the problem
- Impact explanation
- Affected event count
Event List:
- Shows up to 5 affected events
- Each with [View] button to inspect
- "...and X more" if > 5 events affected
Severity Levels
| Level | Color | Priority | Action Required |
|---|---|---|---|
| CRITICAL | 🔴 Red | Immediate | Fix before shipping |
| WARNING | 🟡 Yellow | Important | Should be optimized |
| INFO | 🔵 Blue | Optional | Informational only |
No Warnings State
When everything is working well:
✓ All Good!
No performance issues or warnings detected.
Check the Warnings tab regularly during development. Addressing warnings early prevents performance problems from accumulating and becoming harder to fix later.
👂 Listeners Tab
Comprehensive overview of all active event subscriptions.
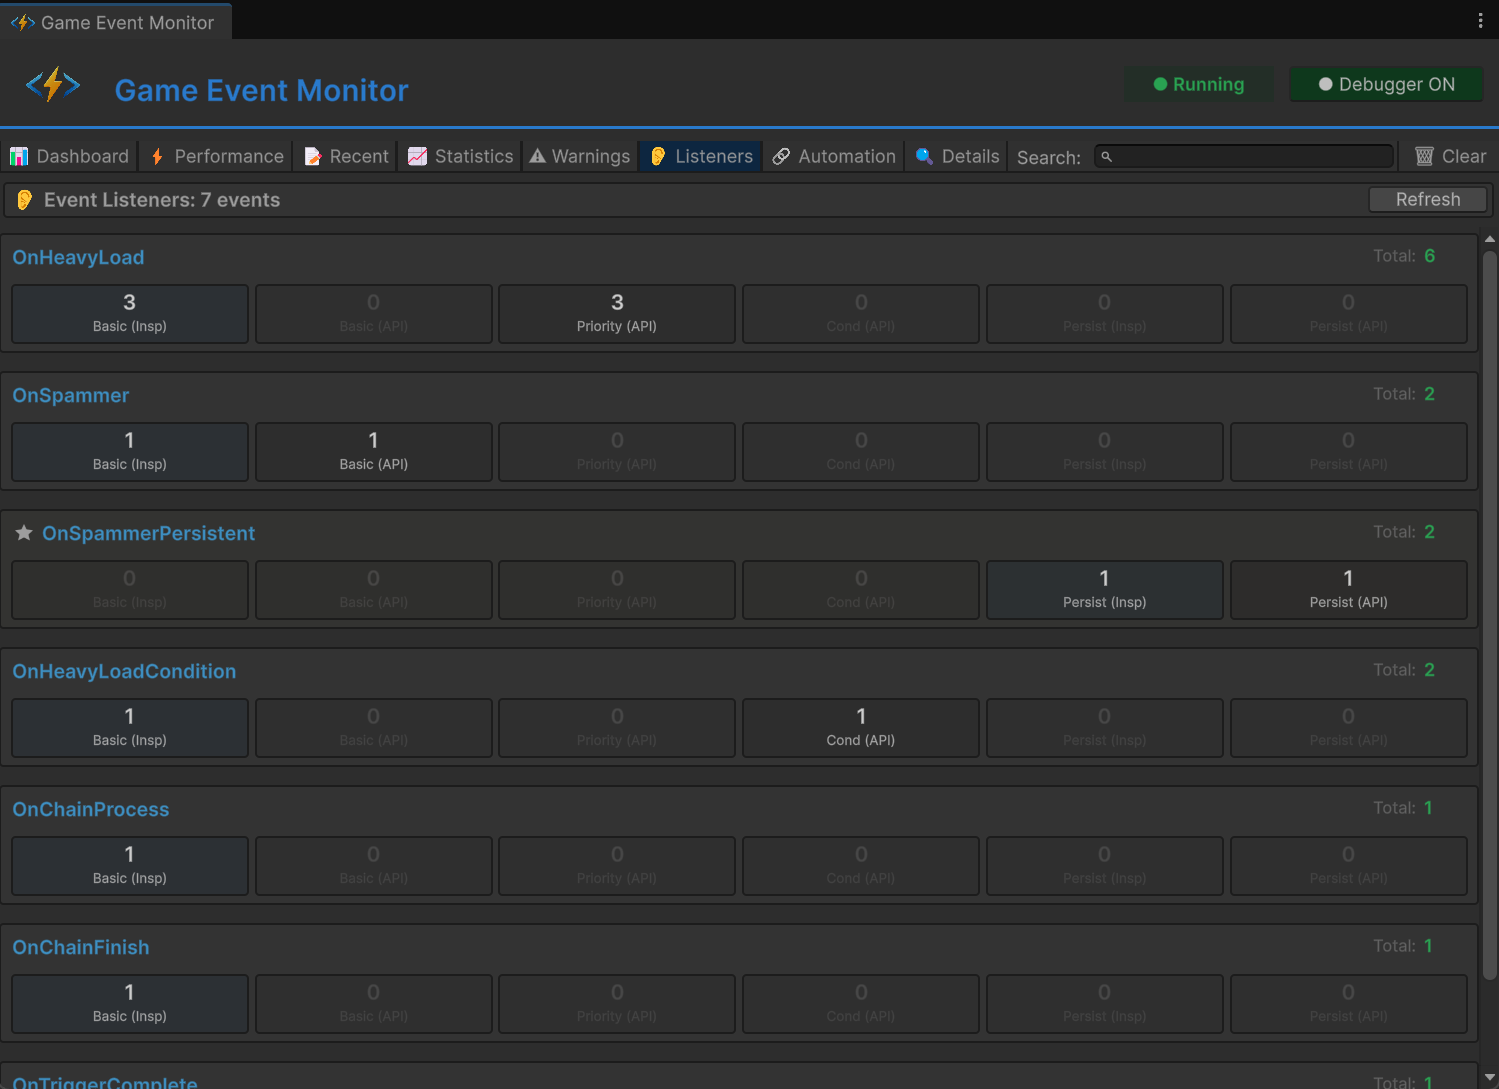
Listener Cards
Each event with active listeners is displayed as an expandable card:
Card Header:
EventName ⭐ (if persistent) Total: 12
- Event Name: Name of the event (blue, bold)
- ⭐ Icon: Appears for persistent events (survives scene loads)
- Total Count: Sum of all listener types (green)
Listener Type Breakdown
Each card shows 6 blocks representing different listener types:
Visual Layout
┌─────────────┬─────────────┬─────────────┬─────────────┬─────────────┬─────────────┐
│ Basic(Insp) │ Basic(API)  │Priority(API)│ Cond(API)   │Persist(Insp)│Persist(API) │
│     3       │     2       │     4       │     1       │     0       │     2       │
└─────────────┴─────────────┴─────────────┴─────────────┴─────────────┴─────────────┘
Block Types
| Block | Description | Source |
|---|---|---|
| Basic (Insp) | Basic listeners from Inspector | 🔵 Blue (Inspector) |
| Basic (API) | Basic listeners from code | ⚫ Dark (API) |
| Priority (API) | Priority listeners from code | ⚫ Dark (API) |
| Cond (API) | Conditional listeners from code | ⚫ Dark (API) |
| Persist (Insp) | Persistent from Inspector | 🔵 Blue (Inspector) |
| Persist (API) | Persistent from code | ⚫ Dark (API) |
Color Coding
- 🔵 Blue Blocks: Configured in Unity Inspector (GameEventManager)
- ⚫ Dark Blocks: Registered via code (
AddListener,AddPriorityListener, etc.) - Faded/Gray: No listeners of this type (count = 0)
- White Numbers: Active listeners present
Understanding the Data
Example Card:
PlayerHealthChanged     Total: 8

Basic(Insp): 2  Basic(API): 1  Priority(API): 3  Cond(API): 1  Persist(Insp): 0  Persist(API): 1
Interpretation:
- 8 total listeners subscribed to this event
- 2 basic listeners configured in GameEventManager
- 1 basic listener added via code
- 3 priority listeners (code-based, with custom priorities)
- 1 conditional listener (code-based, executes conditionally)
- 1 persistent listener (code-based, survives scene changes)
Special Indicators
Persistent Event Card:
- Has a ⭐ star icon next to the name
- Tooltip: "Persistent Event"
Basic (Insp)count shows as 0Persist (Insp)shows the Inspector listener count instead
Selected Event:
- Card has blue highlight background
- Indicates this event is selected for detailed viewing
Use Cases
Debugging Subscription Issues:
- Verify listeners are properly registered
- Check if listeners are being removed correctly
- Identify memory leaks from forgotten subscriptions
Architecture Analysis:
- See the balance between Inspector and code-based listeners
- Identify heavily-subscribed events that may need optimization
- Understand listener distribution across your system
Performance Planning:
- High listener counts mean more CPU time per event
- Consider consolidating multiple listeners into one
- Evaluate if all listeners are necessary
If you see listener counts growing over time (especially during scene transitions), you may have a memory leak. Objects should properly unsubscribe in OnDisable() or OnDestroy().
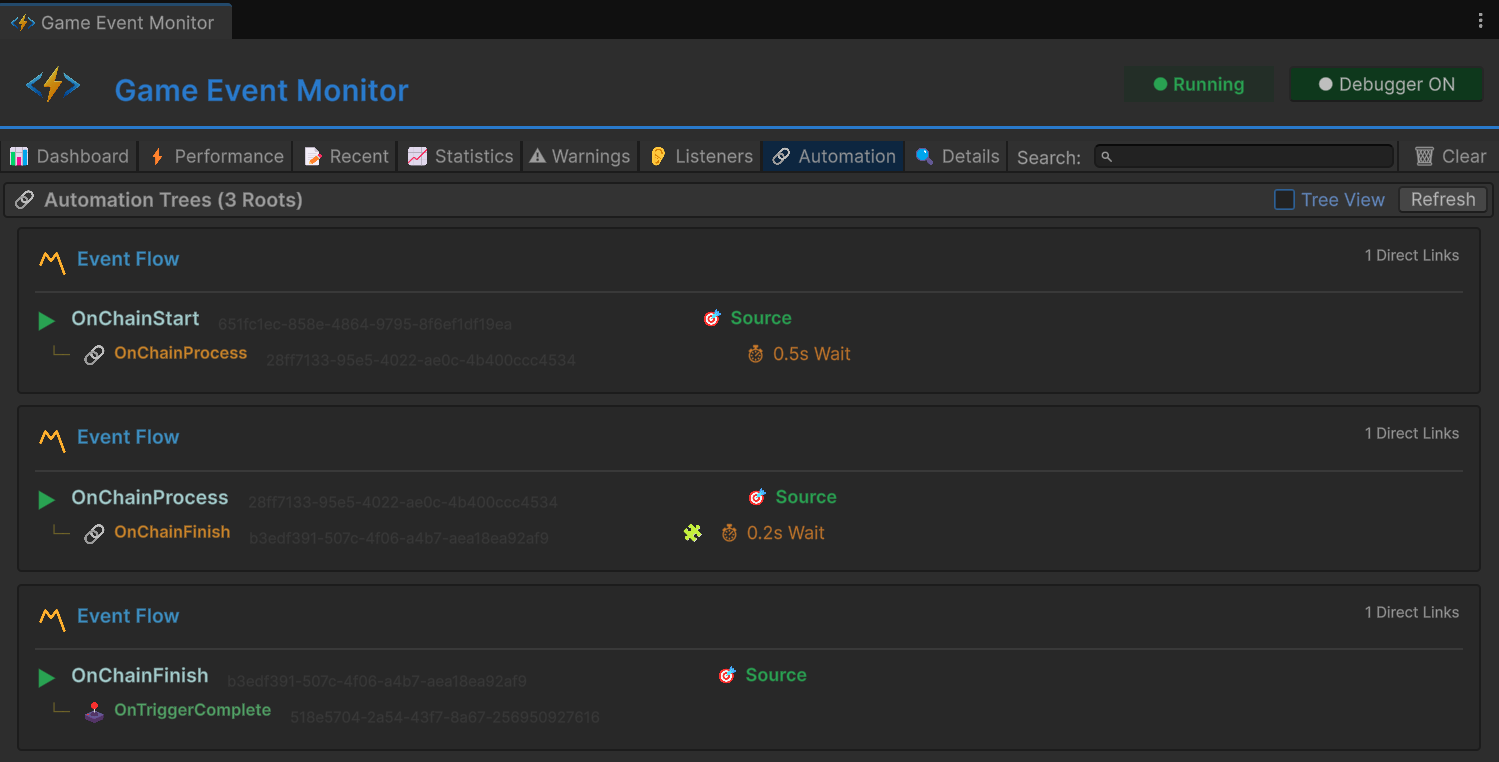
🔗 Automation Tab
Visual representation of trigger and chain event flows.
View Modes
Toggle Options:
- ☑️ Tree View - Shows only root events with full hierarchy
- ☐ Flat View - Shows all events with automation, no hierarchy
Tree View (Recommended)
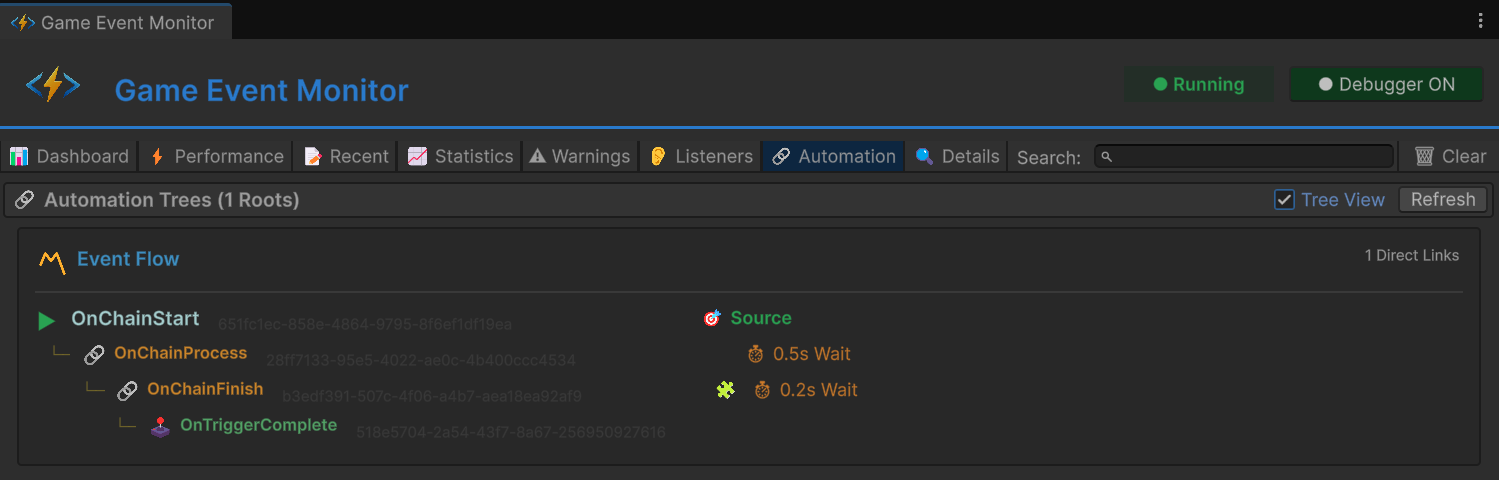
Displays automation flows starting from root events (events that are not triggered by other events):
Tree Structure
▶ RootEvent                                      🎯 Source
  └─ 🕹️ ChildTrigger1
  └─ 🕹️ ChildTrigger2
  └─ 🔗 ChainNode1                                ⏱ 2s Wait
     └─ 🔗 ChainNode2                             ⏳ 1s Wait
        └─ 🔗 ChainNode3
Flat View
Displays automation flows as a chronological list, flattening the hierarchy to show events linked linearly.
Flat Structure
▶ RootEvent                                      🎯 Source
  └─ 🕹️ ChildTrigger1

▶ RootEvent                                      🎯 Source
  └─ 🕹️ ChildTrigger2

▶ RootEvent                                      🎯 Source
  └─ 🔗 ChainNode1                                ⏱ 2s Wait

▶ 🔗 ChainNode1                                      🎯 Source
  └─ 🔗 ChainNode2                                ⏳ 1s Wait

▶ 🔗 ChainNode2                                      🎯 Source
  └─ 🔗 ChainNode3
Understanding the Visualization
Node Types
| Icon | Type | Description | Color |
|---|---|---|---|
| ▶ | Root | Source event (not triggered by others) | 🔵 Cyan |
| 🕹️ | Trigger | Parallel fan-out node | 🟢 Green |
| 🔗 | Chain | Sequential blocking node | 🟠 Orange |
Node Information
Each node displays:
Left Side:
- Tree connector line (└─)
- Type icon (▶/🕹️/🔗)
- Event name (colored by type)
- Event GUID (faded, for debugging)
Right Side Status Icons:
- 🎯 Source - This is a root event
- 🧩 - Has a condition function
- ⏱ Xs Wait - Has a delay before execution
- ⏳ Xs Wait - Has a duration after execution
- ⏩ - Waits for async completion
Reading Flow Patterns
Simple Fan-Out (Triggers)
▶ ButtonClicked
  └─ 🕹️ PlaySound
  └─ 🕹️ ShowFeedback
  └─ 🕹️ LogAnalytics
Pattern: Parallel execution Behavior: All three events fire simultaneously when button clicks Use Case: Independent side effects
Sequential Chain
▶ StartCutscene
  └─ 🔗 FadeOut        ⏱ 0s Wait  ⏳ 1s Wait
     └─ 🔗 LoadScene   ⏱ 0s Wait  ⏳ 2s Wait
        └─ 🔗 FadeIn   ⏱ 0.5s Wait
Pattern: Sequential with delays Behavior:
- FadeOut executes, waits 1 second
- LoadScene executes, waits 2 seconds
- After 0.5 second delay, FadeIn executes
Use Case: Cutscenes, tutorials, loading sequences
Complex Hybrid
▶ EnemyDefeated
  └─ 🕹️ StopMusic
  └─ 🕹️ PlayVictorySound
  └─ 🔗 ShowRewards     ⏱ 1s Wait
     └─ 🔗 SaveGame
  └─ 🕹️ SpawnLoot       🧩
Pattern: Mix of parallel and sequential Behavior:
- Music/sound effects fire immediately (parallel)
- Rewards shown after 1 second, then saves game (sequential)
- Loot spawns conditionally (parallel with condition)
Event Flow Analysis
Example Real-World Flow:
▶ OnPlayerDeath
  └─ 🕹️ StopPlayerInput
  └─ 🕹️ DisablePlayerCollider
  └─ 🔗 PlayDeathAnimation    ⏳ 2s Wait
     └─ 🔗 ShowDeathUI         ⏱ 0.5s Wait  ⏳ 3s Wait
        └─ 🔗 RespawnPlayer    🧩
           └─ 🕹️ ResetPlayerState
           └─ 🕹️ UpdateCheckpoint
Flow Breakdown:
- Immediate Actions (Triggers):
- Stop player input
- Disable collision
- Death Animation (Chain):
- Play animation
- Wait 2 seconds for animation to complete
- Show UI (Chain):
- Wait 0.5 seconds (transition delay)
- Show death screen
- Wait 3 seconds (player can see screen)
- Conditional Respawn (Chain with condition 🧩):
- Only if player has lives remaining
- Respawn player at checkpoint
- Cleanup (Triggers):
- Reset player stats
- Save new checkpoint
Status Icon Reference
| Icon | Meaning | Details |
|---|---|---|
| 🎯 Source | Root event | Not triggered by any other event |
| 🧩 | Conditional | Has a condition check (may not execute) |
| ⏱ Xs | Start Delay | Waits X seconds before executing |
| ⏳ Xs | Duration Wait | Waits X seconds after executing (blocks chain) |
| ⏩ | Async Wait | Waits for coroutine/async completion |
Recursive Detection
If an event triggers itself (directly or indirectly), the tree stops at the recursive node to prevent infinite display:
▶ OnValueChanged
  └─ 🔗 UpdateValue
     └─ 🔗 OnValueChanged  ⚠️ (Recursive - stopped)
Recursive event flows appear in the Warnings tab as potential infinite loops. Always use guards in your code to prevent actual recursion.
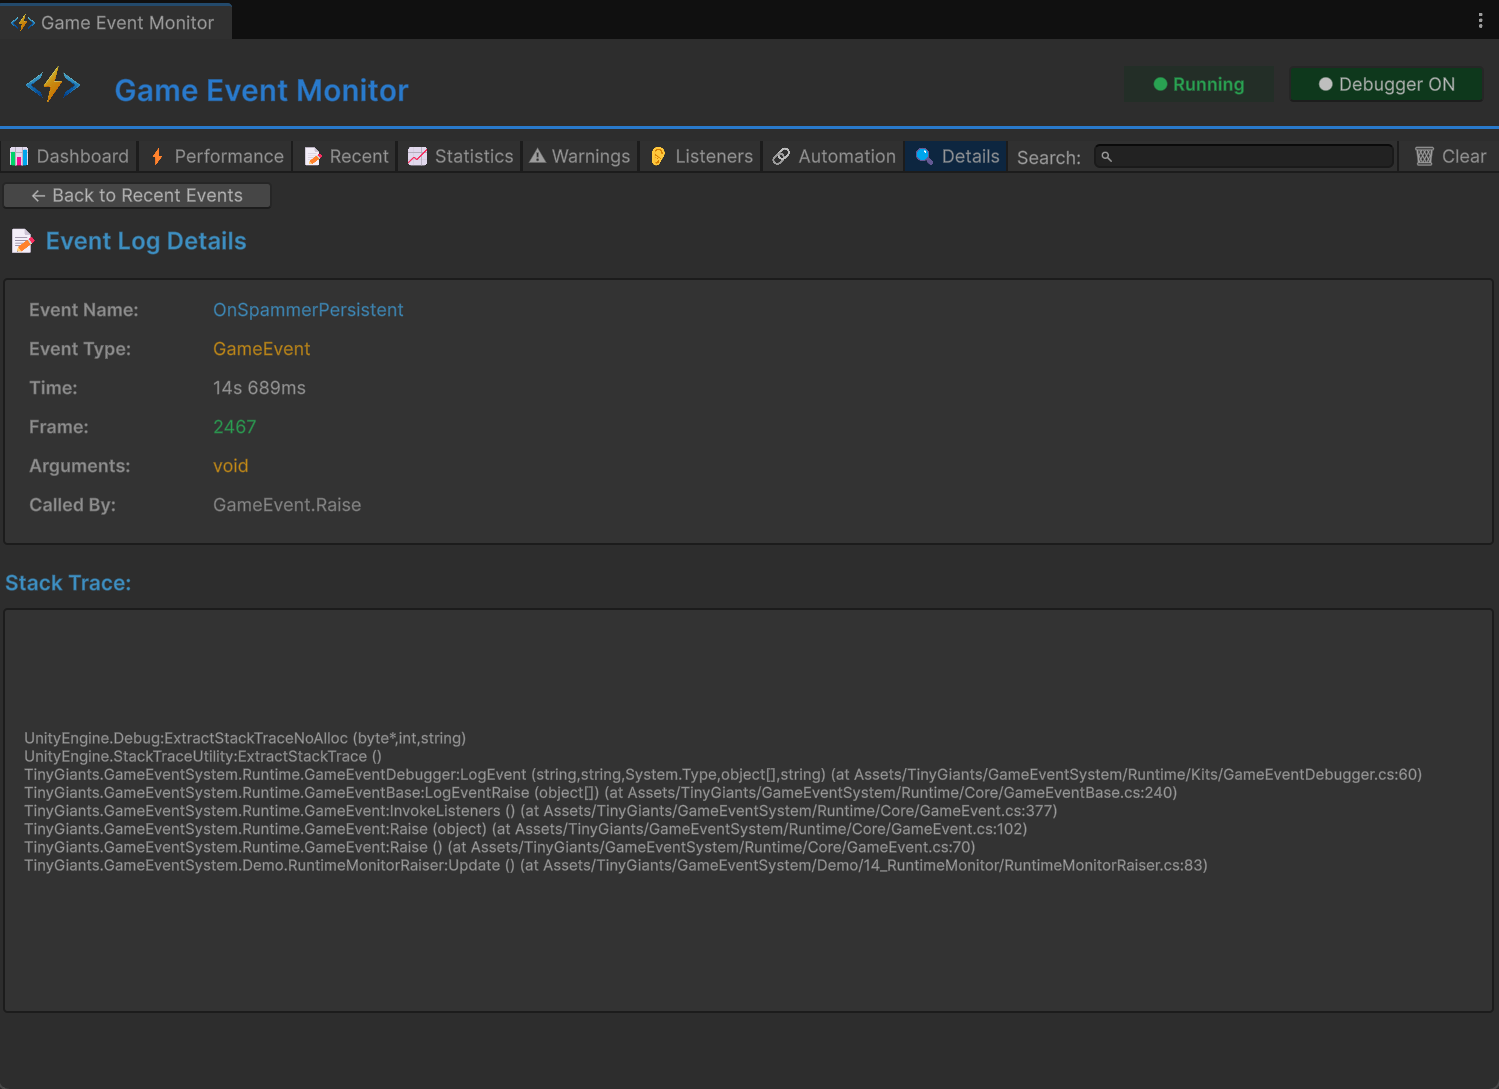
🔍 Details Tab
Deep dive into individual event information and execution history.
Navigation
The Details tab opens automatically when you:
- Click [Details] button from Recent Events
- Click [View Logs] button from Statistics
- Click [View] button from Warnings
At the top:
- ← Back to [Previous Tab] - Return to where you came from
Log Details View
When viewing a specific log entry:
Event Information Card:
| Field | Description |
|---|---|
| Event Name | Full name of the event |
| Event Type | Generic type (e.g., GameEvent<float>) |
| Time | Precise timestamp (HH:MM:SS.mmm) |
| Frame | Frame number when executed |
| Arguments | Argument values passed |
| Called By | Method that raised the event |
Stack Trace Section:
Stack Trace:
at TinyGiants.GameEventSystem.Runtime.GameEvent`1.Raise(T argument)
at PlayerController.TakeDamage(Int32 damage) in Assets/Scripts/PlayerController.cs:line 142
at EnemyController.Attack() in Assets/Scripts/EnemyController.cs:line 89
at EnemyController.Update() in Assets/Scripts/EnemyController.cs:line 52
...
Use Cases:
- Track down where events originate
- Debug unexpected event calls
- Understand call chains
- Identify performance bottlenecks
Event Statistics View
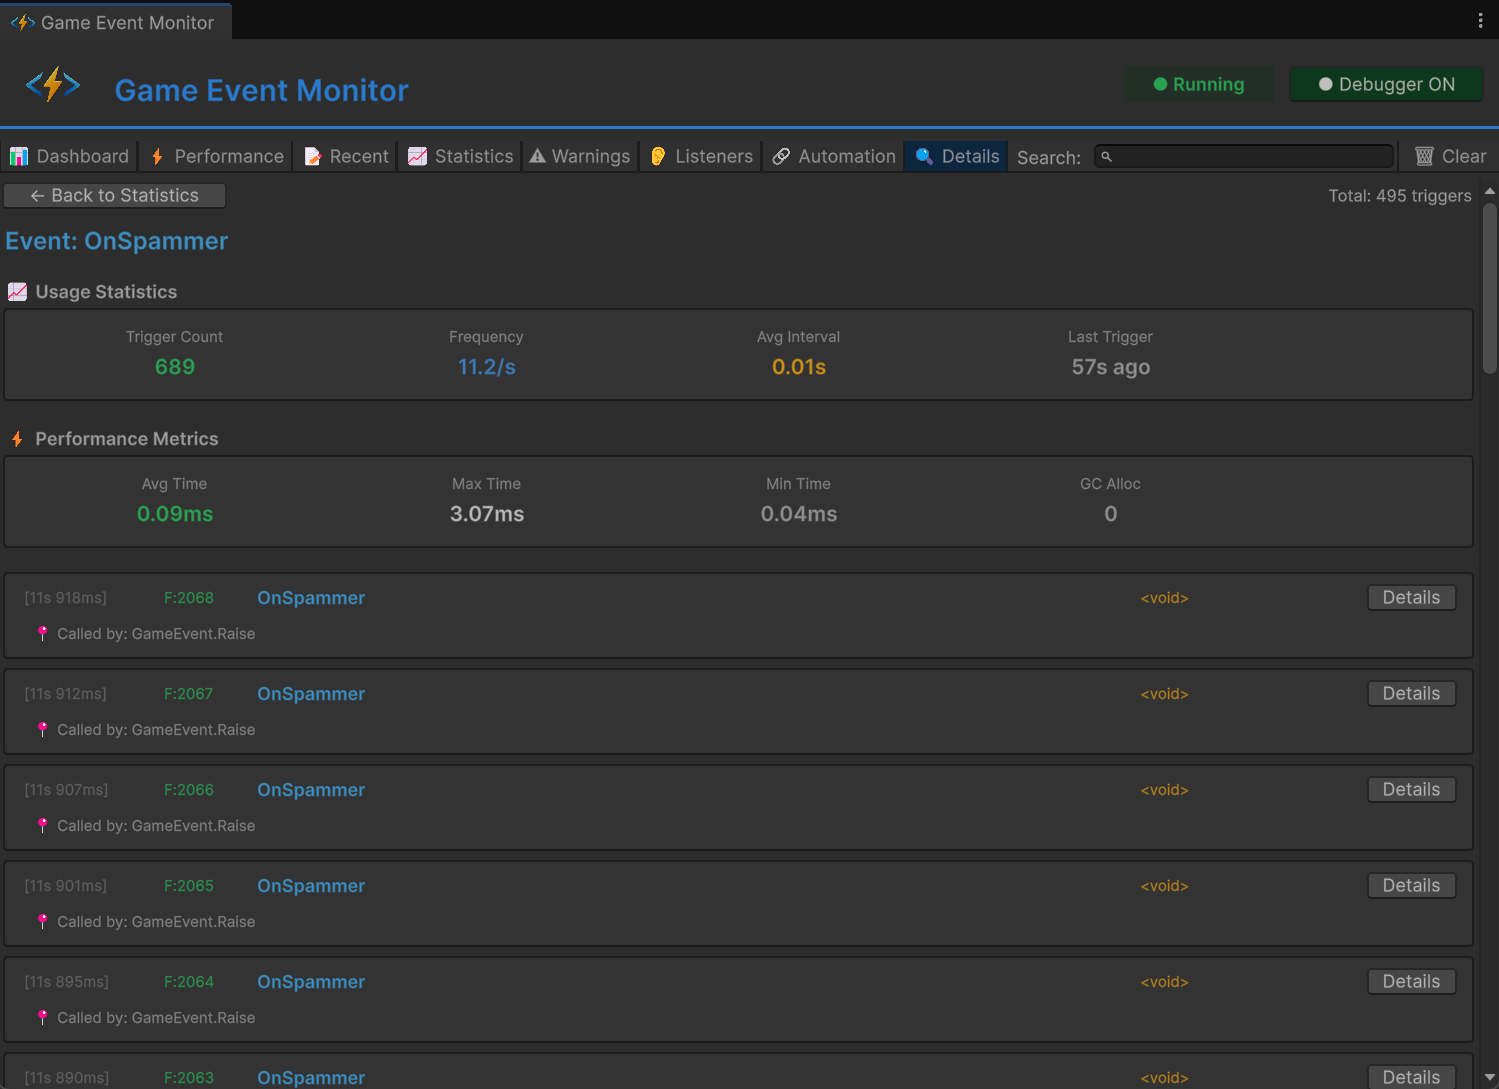
When viewing all logs for a specific event:
Header:
Event: PlayerHealthChanged Total: 245 triggers
Usage Statistics Card:
| Metric | Description |
|---|---|
| Trigger Count | Total executions |
| Frequency | Triggers per second |
| Avg Interval | Time between triggers |
| Last Trigger | Relative time since last execution |
Performance Metrics Card (if available):
| Metric | Description | Color |
|---|---|---|
| Avg Time | Average execution duration | Green/Yellow/Red |
| Max Time | Slowest execution | White |
| Min Time | Fastest execution | Gray |
| GC Alloc | Garbage collections | Red if > 0 |
Recent Logs:
Shows the last 50 executions of this event in reverse chronological order:
[14:52:33.145]  F:3201  PlayerHealthChanged  <GameEvent<float>>  [Details]
  📍 Called by: DamageSystem.ApplyDamage()

[14:52:31.089]  F:3180  PlayerHealthChanged  <GameEvent<float>>  [Details]
  📍 Called by: HealthRegen.Tick()

...
Use Cases
Debugging Event Issues:
- Go to Recent Events tab
- Find problematic event execution
- Click [Details] to see stack trace
- Identify calling code
- Fix the issue
Performance Analysis:
- Go to Statistics tab
- Click [View Logs] on slow event
- Review performance metrics
- Check execution patterns
- Optimize based on data
Event Flow Understanding:
- Trigger an event chain
- View logs for each event
- Verify execution order
- Check timing between events
- Validate behavior
🛠️ Advanced Features
Debugger Control
Debugger Toggle Button (in header):
- ● Debugger ON (green) - Actively recording all event data
- ○ Debugger OFF (red) - Not recording (saves performance)
When to Disable:
- During performance-critical gameplay testing
- When recording gameplay footage
- To reduce Editor overhead
- When you don't need monitoring
The debugger has minimal overhead (~0.1-0.5ms per event), but disabling it during final performance testing gives you the most accurate metrics.
Clear Data Options
Click the 🗑 Clear button to access options:
Clear Menu:
- Clear Logs Only - Removes event execution history
- Clear Statistics Only - Resets trigger counts and frequency data
- Clear Performance Data - Resets execution time measurements
- Clear All Data - Complete reset (requires confirmation