14 Runtime Monitor: The Stress Test Facility
📍 Demo Info
-
Scene Preview
-
Scene Path
Assets/TinyGiants/GameEventSystem/Demo/14_RuntimeMonitor/14_RuntimeMonitor.unityGoalTo demonstrate the Enterprise-Grade Observability of the system. This scene acts as a "Stress Test Facility" configured to generate high-frequency traffic, artificial lag, and complex dynamic chains, allowing you to explore every tab of the Game Event Monitor.
📝 Description
Why do you need a Monitor?
In production, events fire thousands of times per second. Debug.Log creates garbage and is hard to read. You need a dedicated profiler to answer:
- "Which event is causing that frame drop?"
- "Is this event firing too often?"
- "Who is actually listening to this event right now?"
The 4 Test Units:
- Unit A (The Spammer): Fires >60 times/sec. Used to test Frequency Tracking.
- Unit B (The Heavy Lifter): Simulates CPU load (5ms+). Used to test Performance Profiling.
- Unit C (The Reactor): Runs a code-driven sequence. Used to test Automation Visualization.
- Unit D (The Ghost): Fires with no listeners. Used to test Warning Systems.
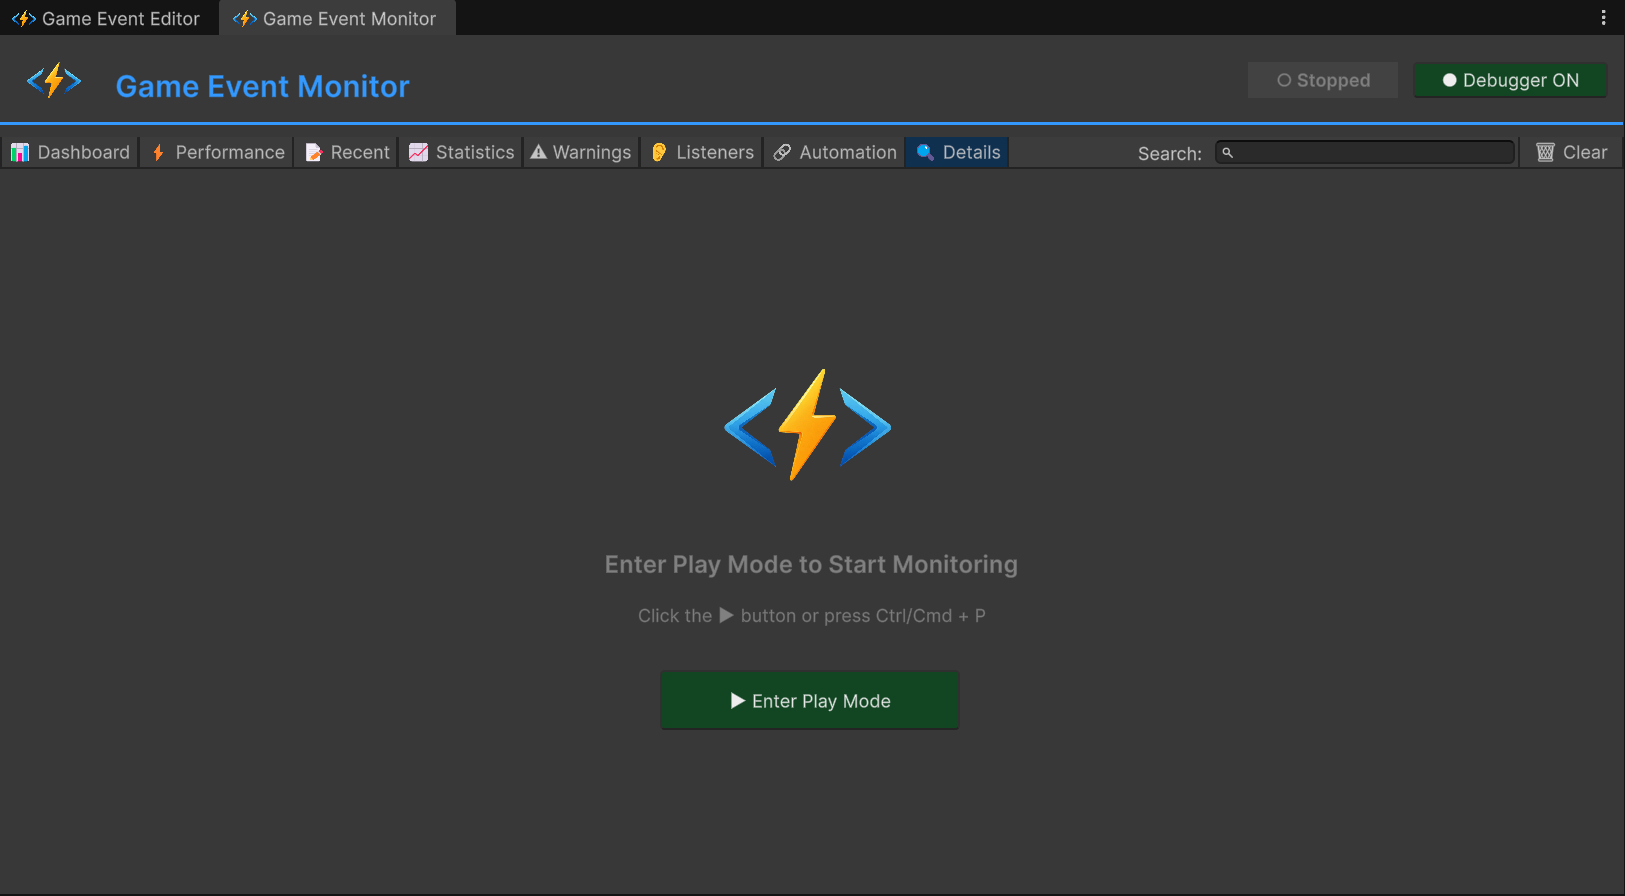
🎮 How to Test (Preparation)
Before analyzing, we need to generate data.
- Open the Monitor:
Tools > TinyGiants > Game Event Monitor. - Enter Play Mode.
- Activate Unit A: Click "Toggle Spammer" (Keep it running).
- Activate Unit B: Click "Trigger Heavy Load" (Click multiple times).
- Activate Unit C: Click "Fire Chain Reaction".
- Activate Unit D: Click "Fire Ghost Event".
Now, let's analyze the results tab by tab.
📊 Monitor Analysis: Tab by Tab
1. 🏠 Dashboard (The Overview)
This is your landing page. It aggregates metrics from all subsystems into a single health report.
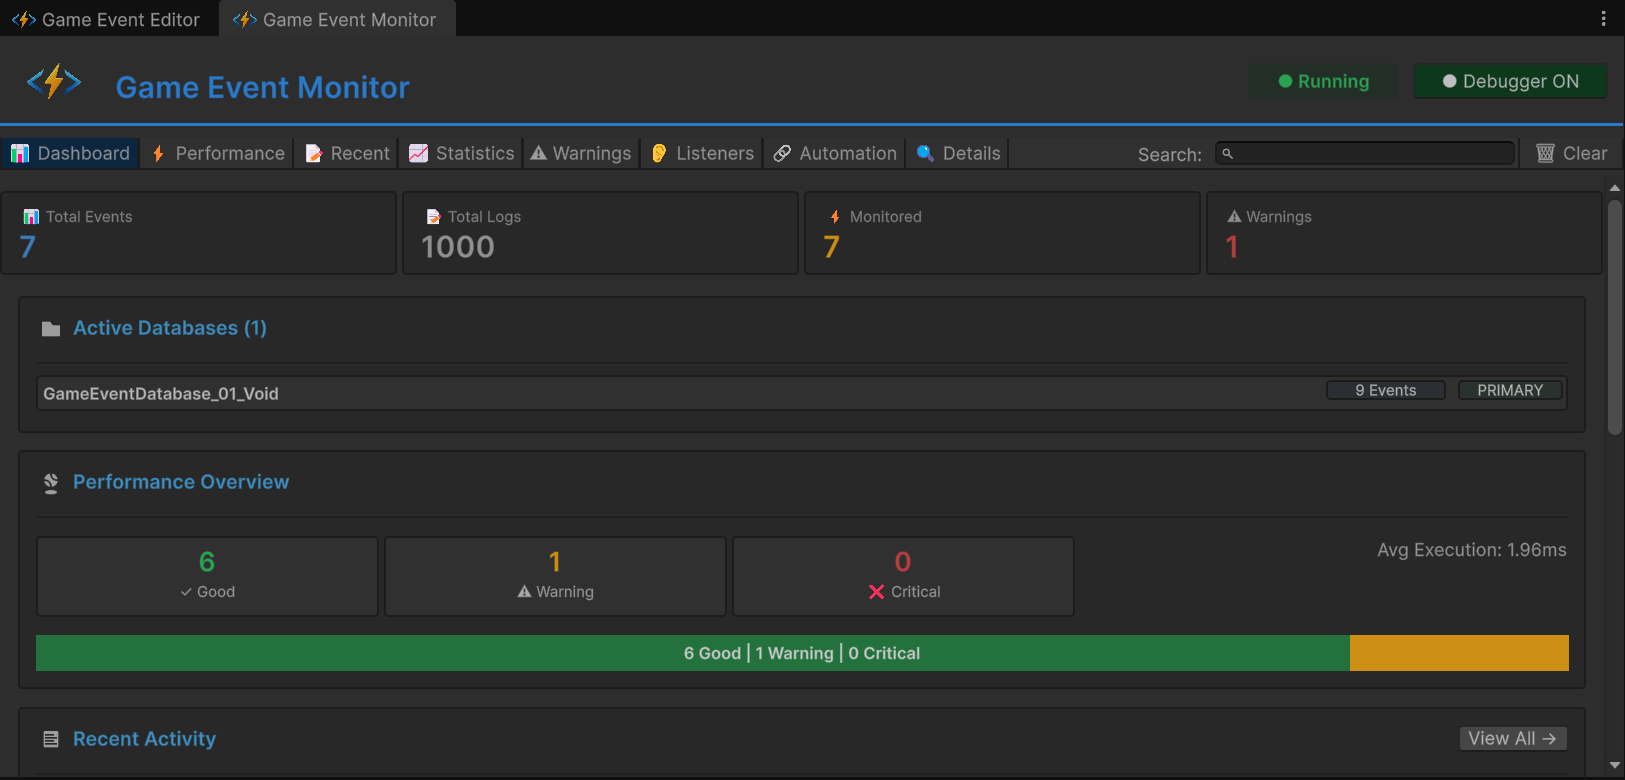
- Metric Cards:
- Total Events: Count of all loaded assets.
- Total Logs: Cumulative fire count.
- Monitored: Active performance trackers.
- Warnings: Current active issues.
- Active Databases: Shows which database assets are loaded, highlighting the PRIMARY one.
- Performance Overview: A "Traffic Light" bar (Green/Yellow/Red) summarizing system latency.
- Recent Activity: A mini-log of the last 15 firings.
- Quick Warnings: The top 3 critical alerts needing attention.
2. ⚡ Performance (Lag Detection)
Focus: Unit B (Heavy Load)
This tab ranks events by their execution cost to find bottlenecks.
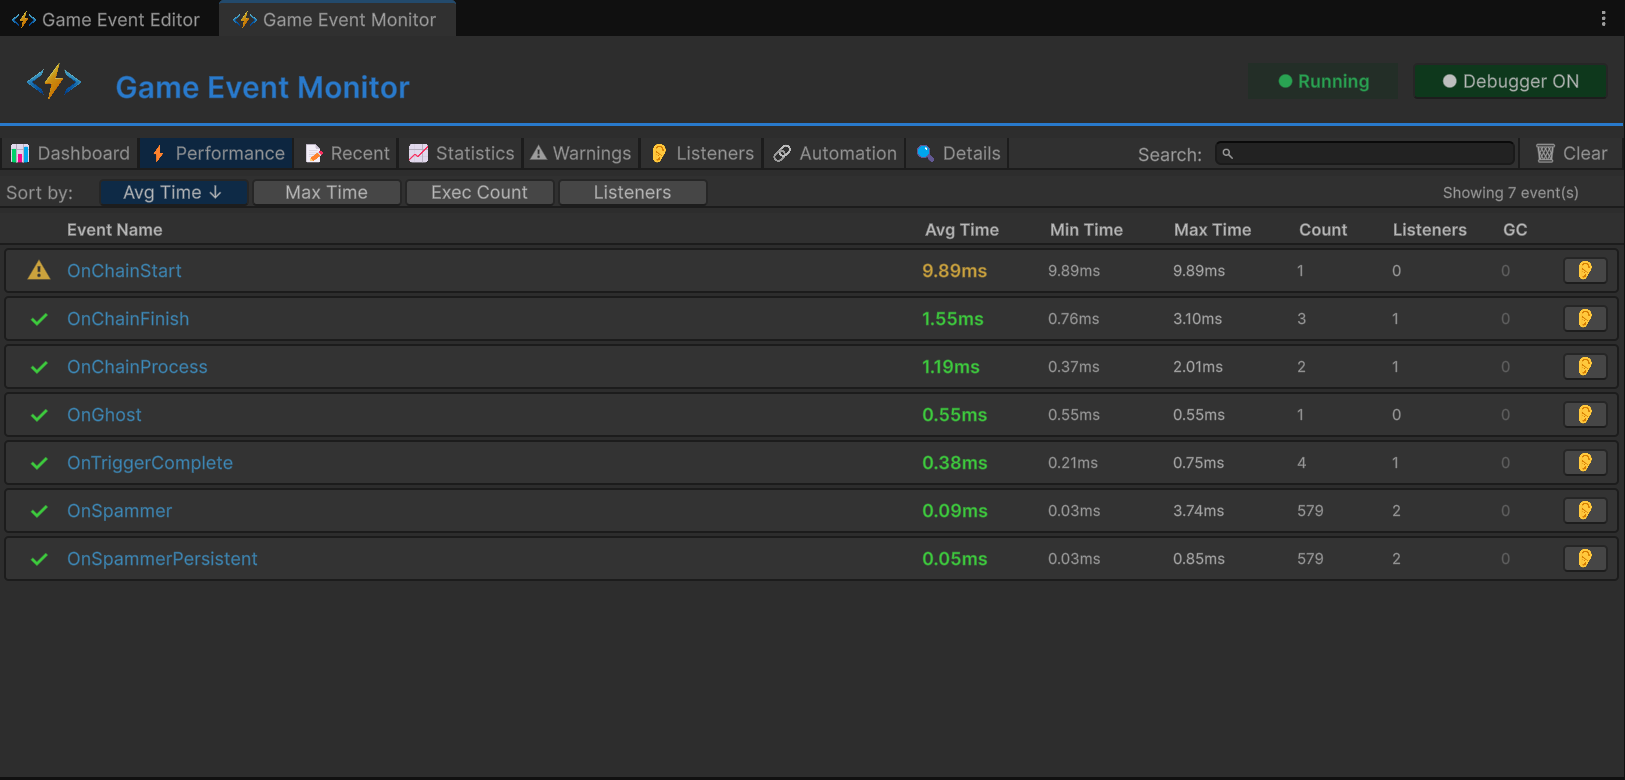
- Metrics:
- Avg/Min/Max Time: Precise execution time in milliseconds.
- Listeners: Average listener count per fire.
- GC: Garbage Collection allocation per frame.
- Observation: Locate
OnHeavyLoad.- The timestamp will show ~6.00ms (Yellow) or ~12.00ms (Red).
- This confirms the simulated lag from
Thread.Sleep(6).
3. 📝 Recent Events (The Log)
Focus: Global Stream
A high-performance scrolling log. Unlike the Unity Console, this is specialized for events.
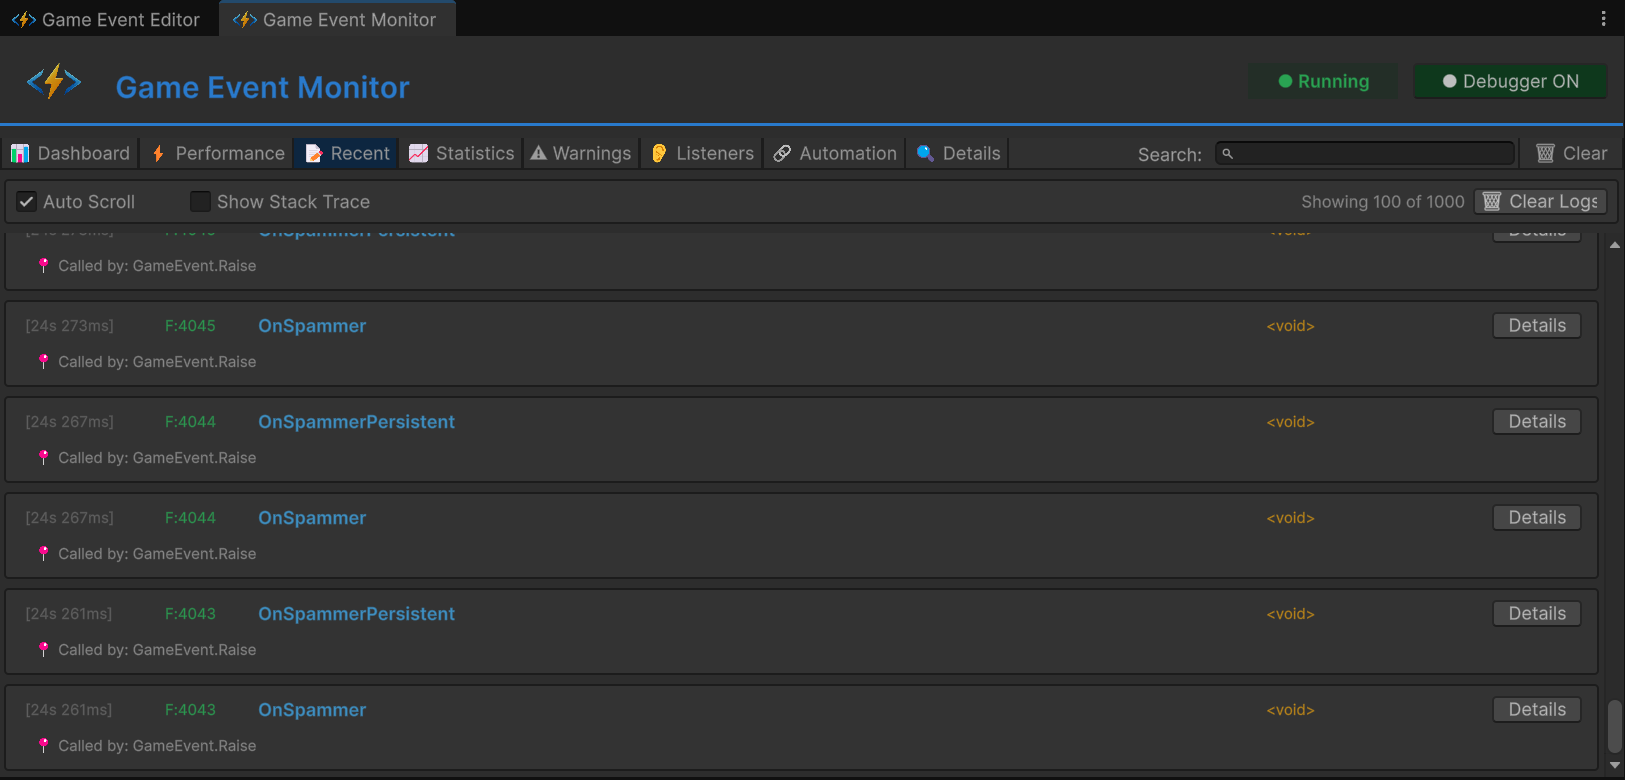
- Frame: The exact frame number (e.g.,
F:1450) where the event fired. - Arguments: Displays a preview of the payload (e.g.,
<DamageInfo: 9999>). - Caller Info: Shows exactly which method called
Raise()(e.g.,RuntimeMonitorRaiser.TriggerGhost). - Stack Trace: Toggleable deep inspection.
4. 📈 Statistics (Frequency Analysis)
Focus: Unit A (Spammer)
Tracks long-term usage patterns.
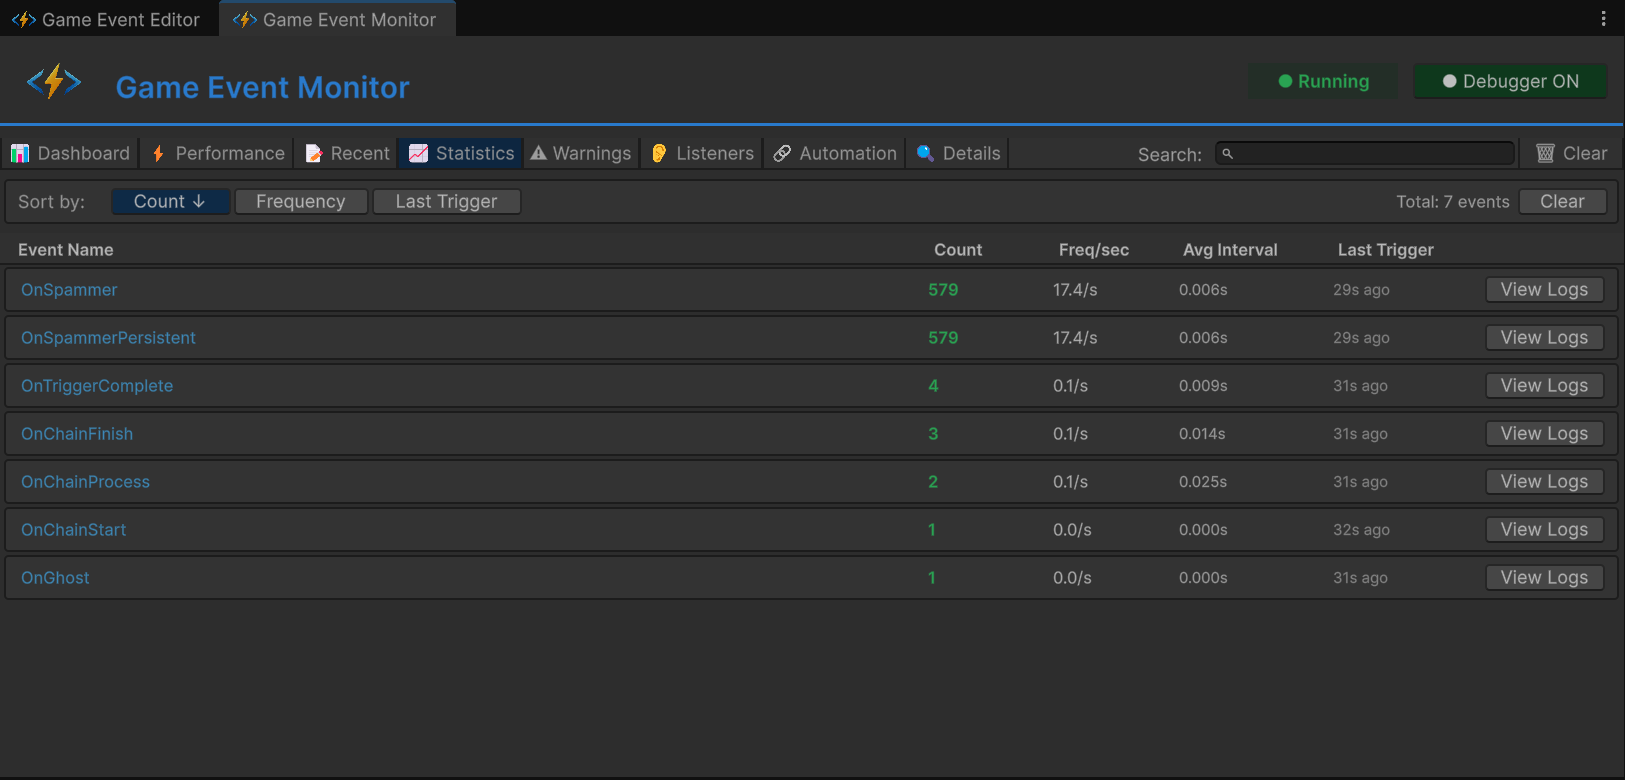
- Trigger Count: Total times fired since play start.
- Freq/sec: Fires per second.
OnSpamEventwill show >60/s (Red Warning).
- Avg Interval: Time between fires.
- Last Trigger: Time since last fire.
5. ⚠ Warnings (Integrity)
Focus: Unit D (The Ghost)
Filters the noise to show only logic errors.
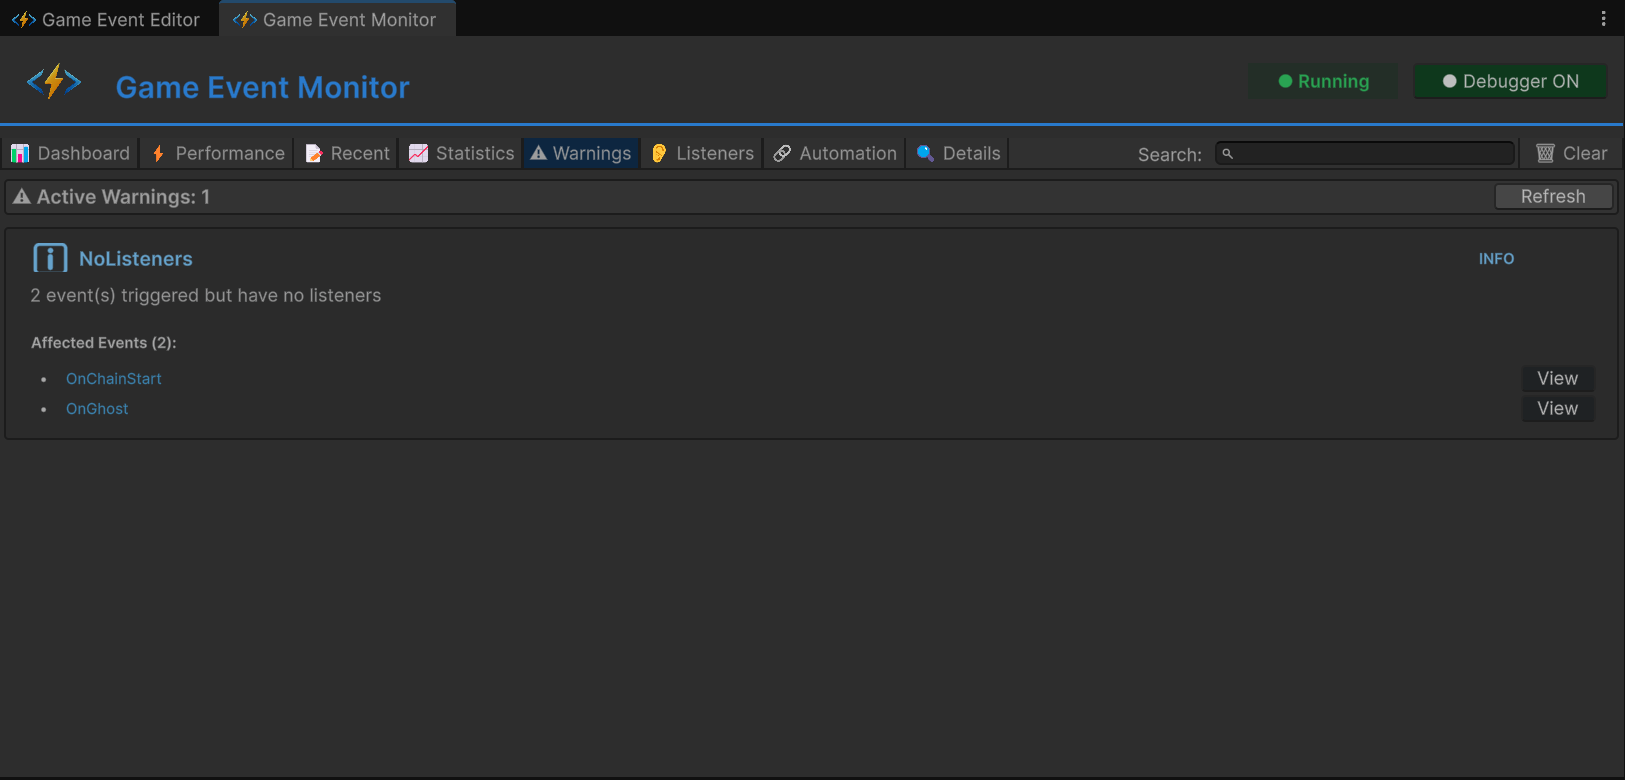
- Severity Levels: Info (Blue), Warning (Yellow), Critical (Red).
- Ghost Event:
OnGhostEventappears here with[No Listeners].- Meaning: You fired a signal, but nobody was listening. This is usually a bug or dead code.
6. 👂 Listeners (Deep Inspection)
Focus: Unit B (Heavy Load)
Select OnHeavyLoad to see a granular breakdown of WHO is listening.
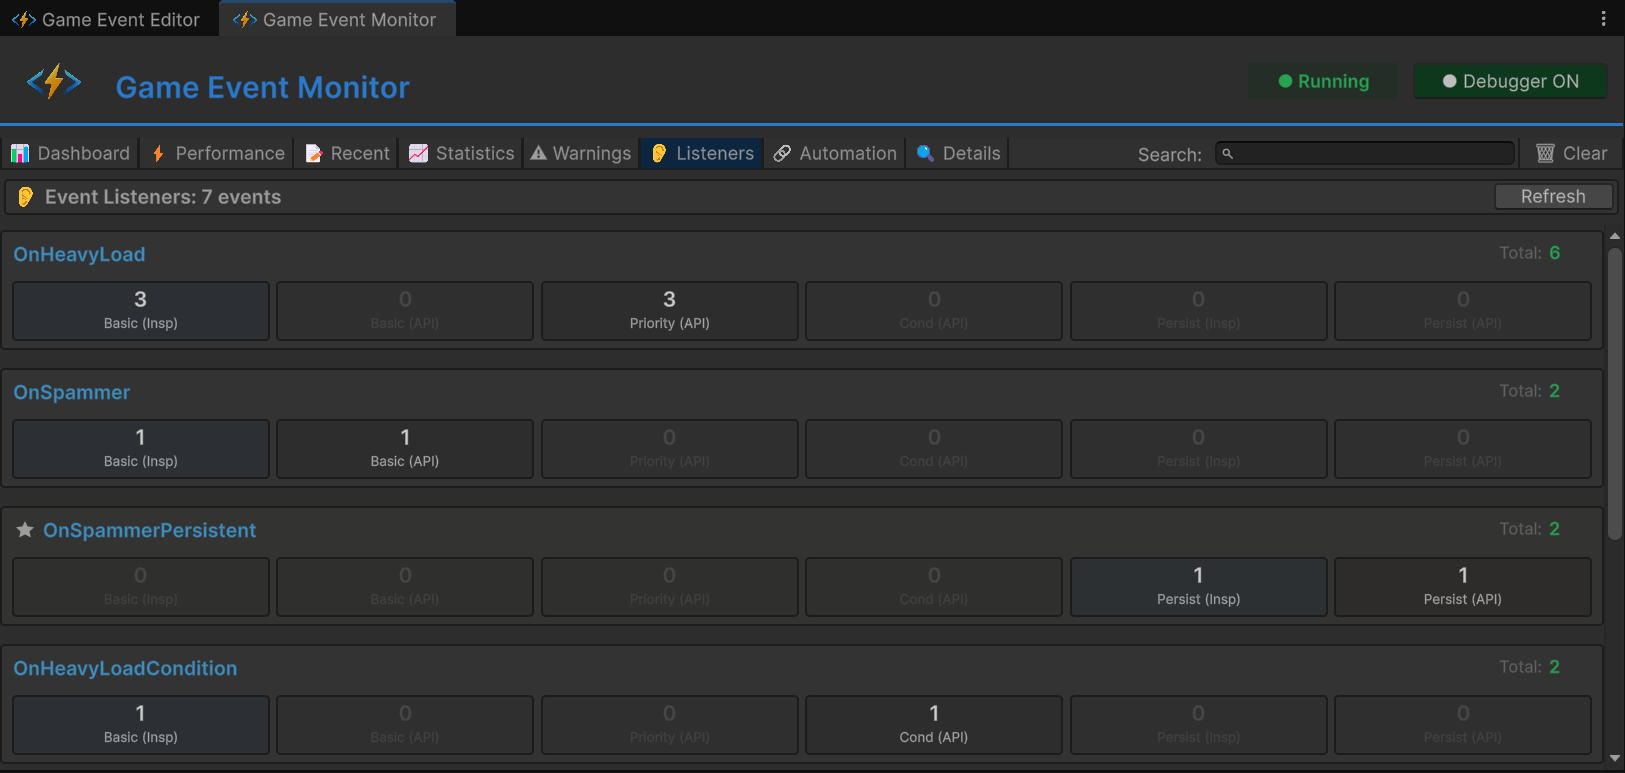
- Breakdown Grid:
- Basic: Inspector vs API counts.
- Priority: High (100), Normal (0), Low (-100).
- Conditional: API-registered predicates.
- Persistent: Global DontDestroyOnLoad listeners.
- Usage: Verify that your code-based subscriptions (
AddListener) and Inspector bindings are registering correctly.
7. 🔗 Automation (Visual Logic)
Focus: Unit C (Chain Reaction)
This tab visualizes dynamic Programmatic Flows created via C# (AddChainEvent).
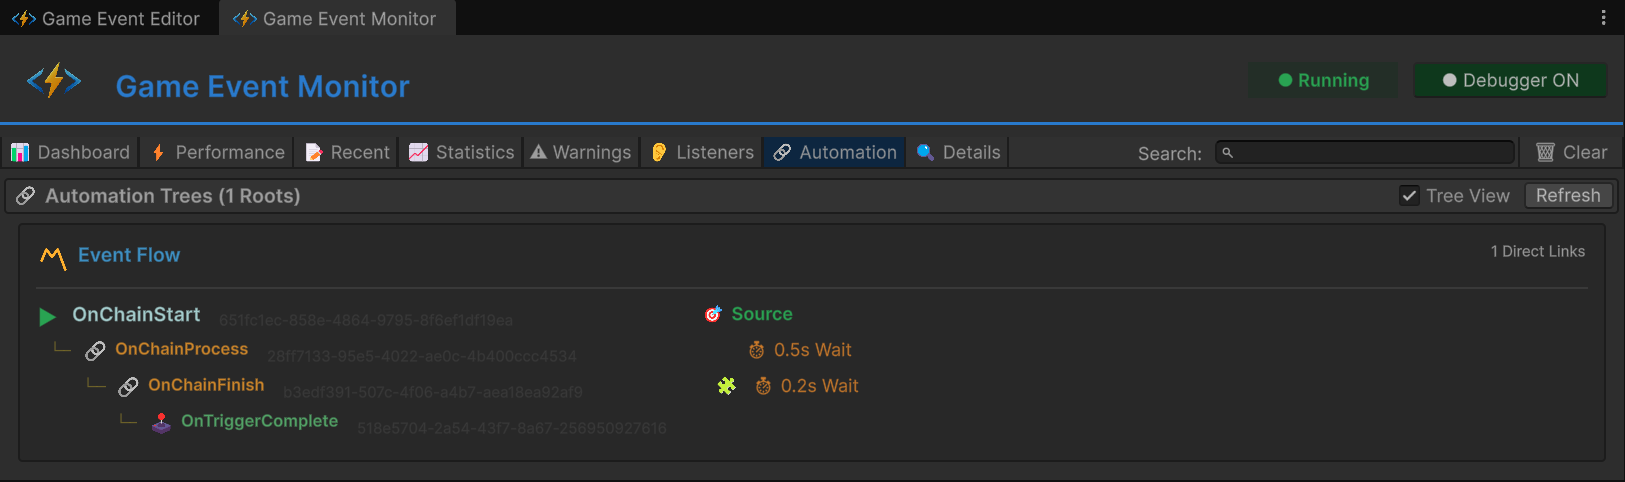
- Tree View: Visualizes the hierarchy recursively.
- ▶ Root:
onChainStart - 🔗 Chain:
onChainProcess(Wait 0.5s) - 🔗 Chain:
onChainFinish(Wait 0.2s) - 🕹️ Trigger:
onTriggerComplete
- ▶ Root:
- Badges: Shows active delays (
⏱ 0.5s), conditions (🧩), and argument passing (⏩).
8. 🔍 Event Details (Deep Dive)
Focus: Drill Down
Clicking "Details" or "View" from any other tab brings you here.
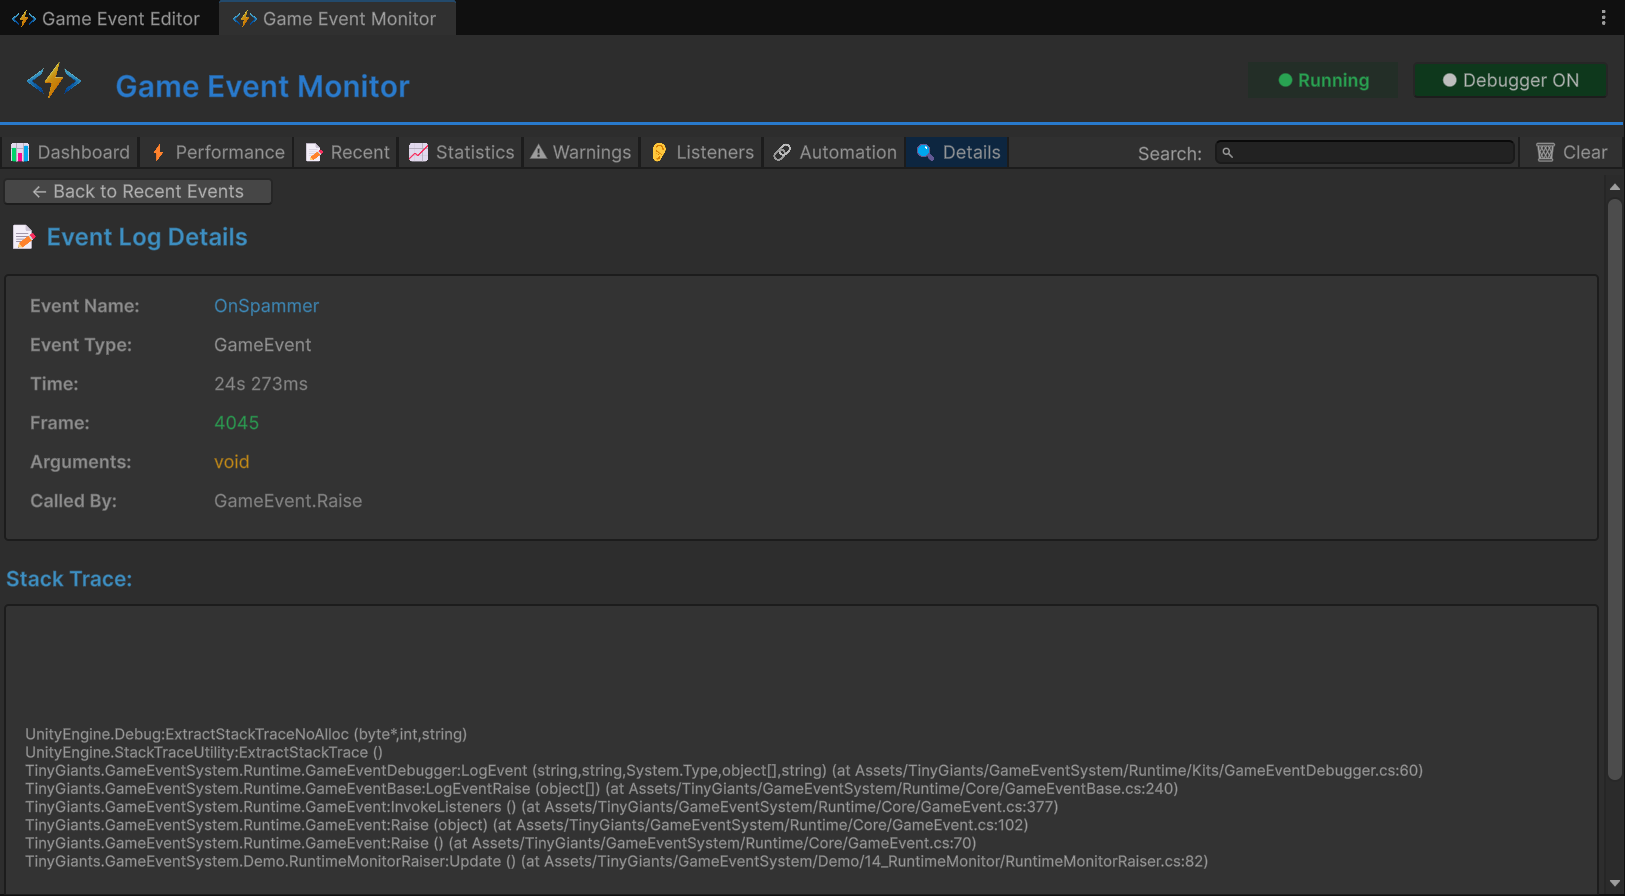
- Metadata: GUID, Type Signature.
- Usage History: A focused log stream for just this event.
- Mini-Stats: Frequency and Performance metrics for this specific event.
- Stack Trace: Full call stack inspection.
💻 Code Walkthrough: How we faked the stress
1. Simulating Lag (Unit B)
In RuntimeMonitorReceiver.cs, we intentionally freeze the thread to trigger the Performance Tab red alert.
public void OnHeavyExecution(GameObject sender, DamageInfo info)
{
    // Artificial Lag for demonstration
    // This forces the event execution time to jump > 5ms
    System.Threading.Thread.Sleep(6);

    Debug.Log($"[Receiver] Processed Heavy Data. Latency simulated.");
}
2. Building Dynamic Automation (Unit C)
In RuntimeMonitorRaiser.cs, we wire up a logic graph via code to populate the Automation Tab.
private void Awake()
{
    // 1. Link Start -> Process (Chain)
    _chainProcessHandle = onChainStart.AddChainEvent(
        targetEvent: onChainProcess,
        delay: 0.5f,
        passArgument: true
    );

    // 2. Link Process -> Finish (Conditional Chain)
    _chainFinishHandle = onChainProcess.AddChainEvent(
        targetEvent: onChainFinish,
        condition: (info) => info.amount > 50f // Filter logic
    );

    // 3. Link Finish -> Complete (Trigger)
    _triggerCompleteHandle = onChainFinish.AddTriggerEvent(
        targetEvent: onTriggerComplete
    );
}
3. Registering Different Listeners (Unit B)
To populate the Listeners Tab, we register multiple callbacks with specific priorities.
private void OnEnable()
{
    // High Priority
    onHeavyLoadEvent.AddPriorityListener(OnHeavyPreCheck, 100);

    // Normal Priority (Simulated Lag here)
    onHeavyLoadEvent.AddPriorityListener(OnHeavyExecution, 0);

    // Low Priority
    onHeavyLoadEvent.AddPriorityListener(OnHeavyPostCheck, -100);

    // Conditional
    onHeavyLoadConditionEvent.AddConditionalListener(
        OnHeavyCriticalWarning,
        (sender, info) => info.isCritical, // Predicate
        priority: 50
    );
}
The Monitor works even in builds (if Development Build is checked), allowing you to profile event performance on target devices.